Summarizing ChemRxiv
A few months ago, the question was posed on science Twitter: “How many people have published on ChemRxiv?”
makes me wonder about the stats at @ChemRxiv https://t.co/Ml5X8F4ckJ
— Egon Willighⓐgen (@egonwillighagen) January 20, 2020
It was a good day for me, which meant I was in the mood to take up the first challenged posed on Twitter. I found that François-Xavier Coudert (@fxcoudert) has previously written a python client for ChemRxiv. I made a pair of pull requests (fxcoudert/tools#9 and fxcoudert/tools#10) to fix some bugs and make it importable from other python modules.
Unlike BioRxiv, the pre-print server for biology, ChemRxiv is implemented with
FigShare. It turns out that all FigShare “institutions”
like ChemRxiv are actually accessible through the main
FigShare API. I think this is pretty cool, and
made sure that the ChemRxiv client that I had updated was actually able to be
run for any institution. Fun fact: the institution code for ChemRxiv is 259.
I got to work writing my own repository to wrap the client, take care of downloading all of the bibliographic information available, and generating some pretty pictures. I originally ran the scripts and generated pictures on January 20th, 2020 (the day Egon posed the question). Since the pandemic has got the whole science community introspecting, I came back to this today and thought it might be worth writing up as a blog post.
Without further ado, here are the most recent charts I’ve generated to answer three main questions. I’ve linked the images in such a way that the charts will be automatically updated with my GitHub repository. This also implicitly means that there’s a history of each image, but because two of them are plotting time course information, the history is already conveyed within the chart.
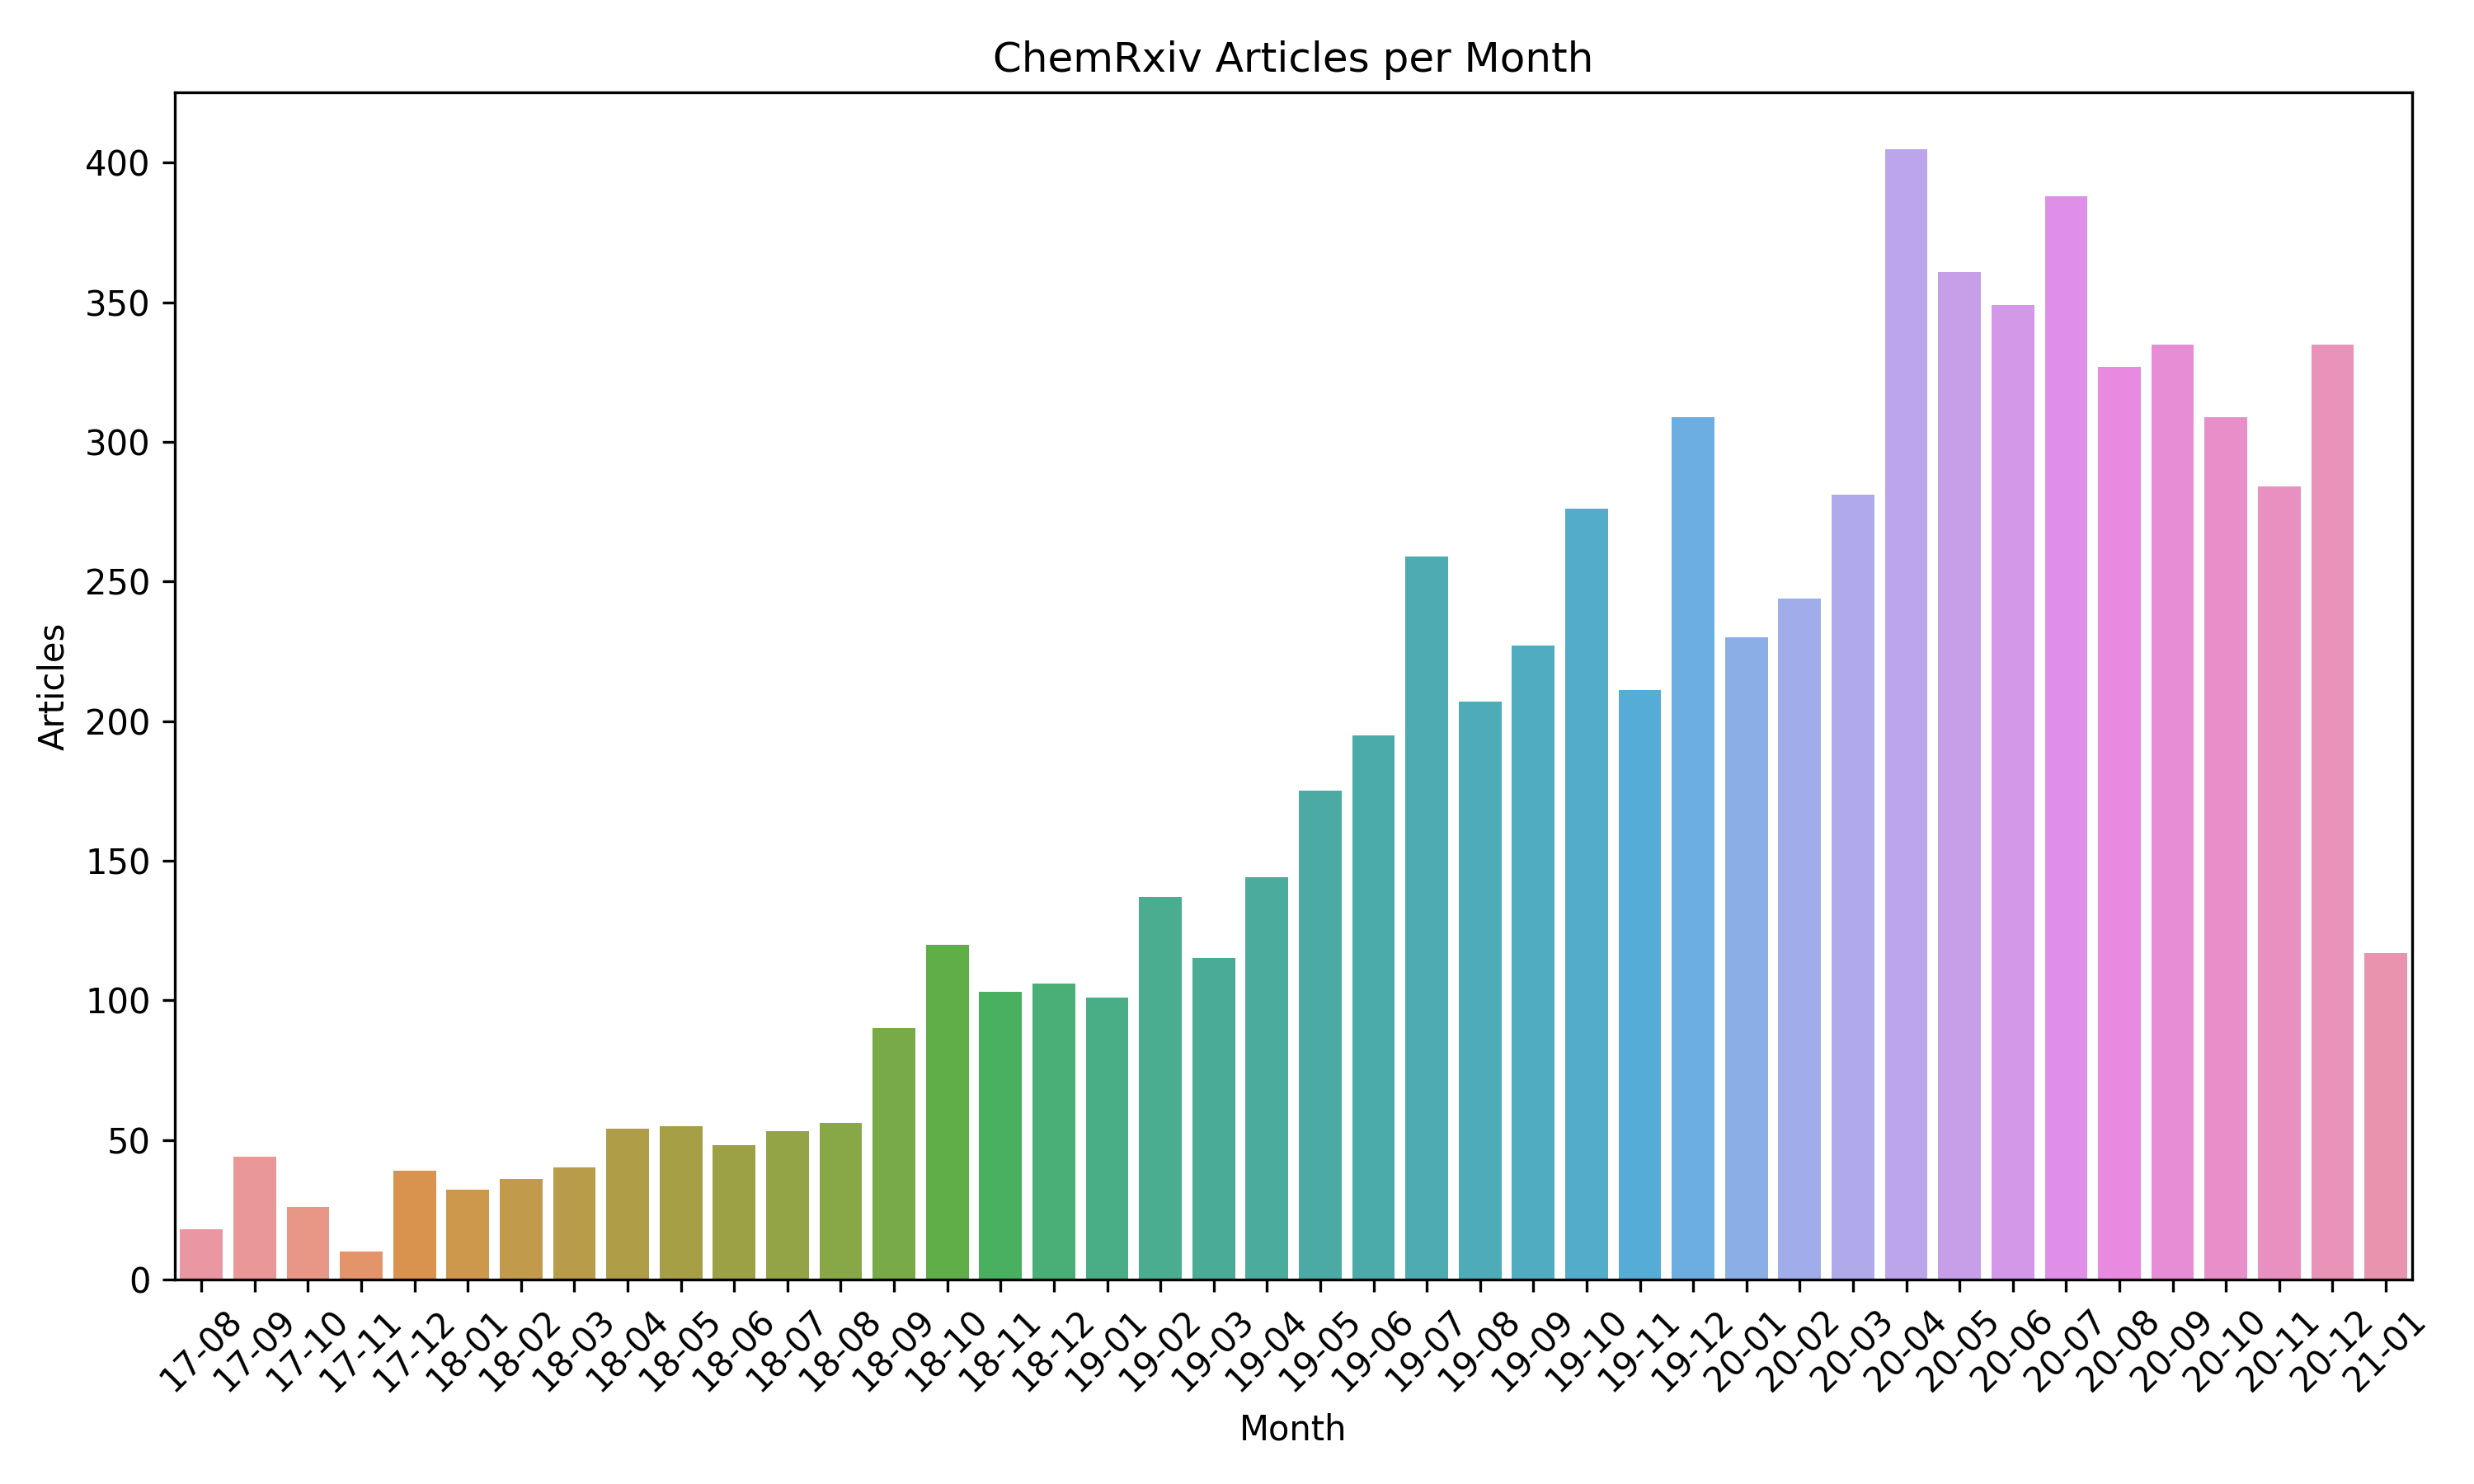
How many articles were contributed each month to ChemRxiv?
How many papers were submitted each month to ChemRxiv? Keep in mind that the current month is likely not complete.
How many unique authors contribute each month to ChemRxiv?
This only counts using the ORCID iDs of the first authors; it’s pretty inconsistent what other identifying information is included in the metadata for each article.

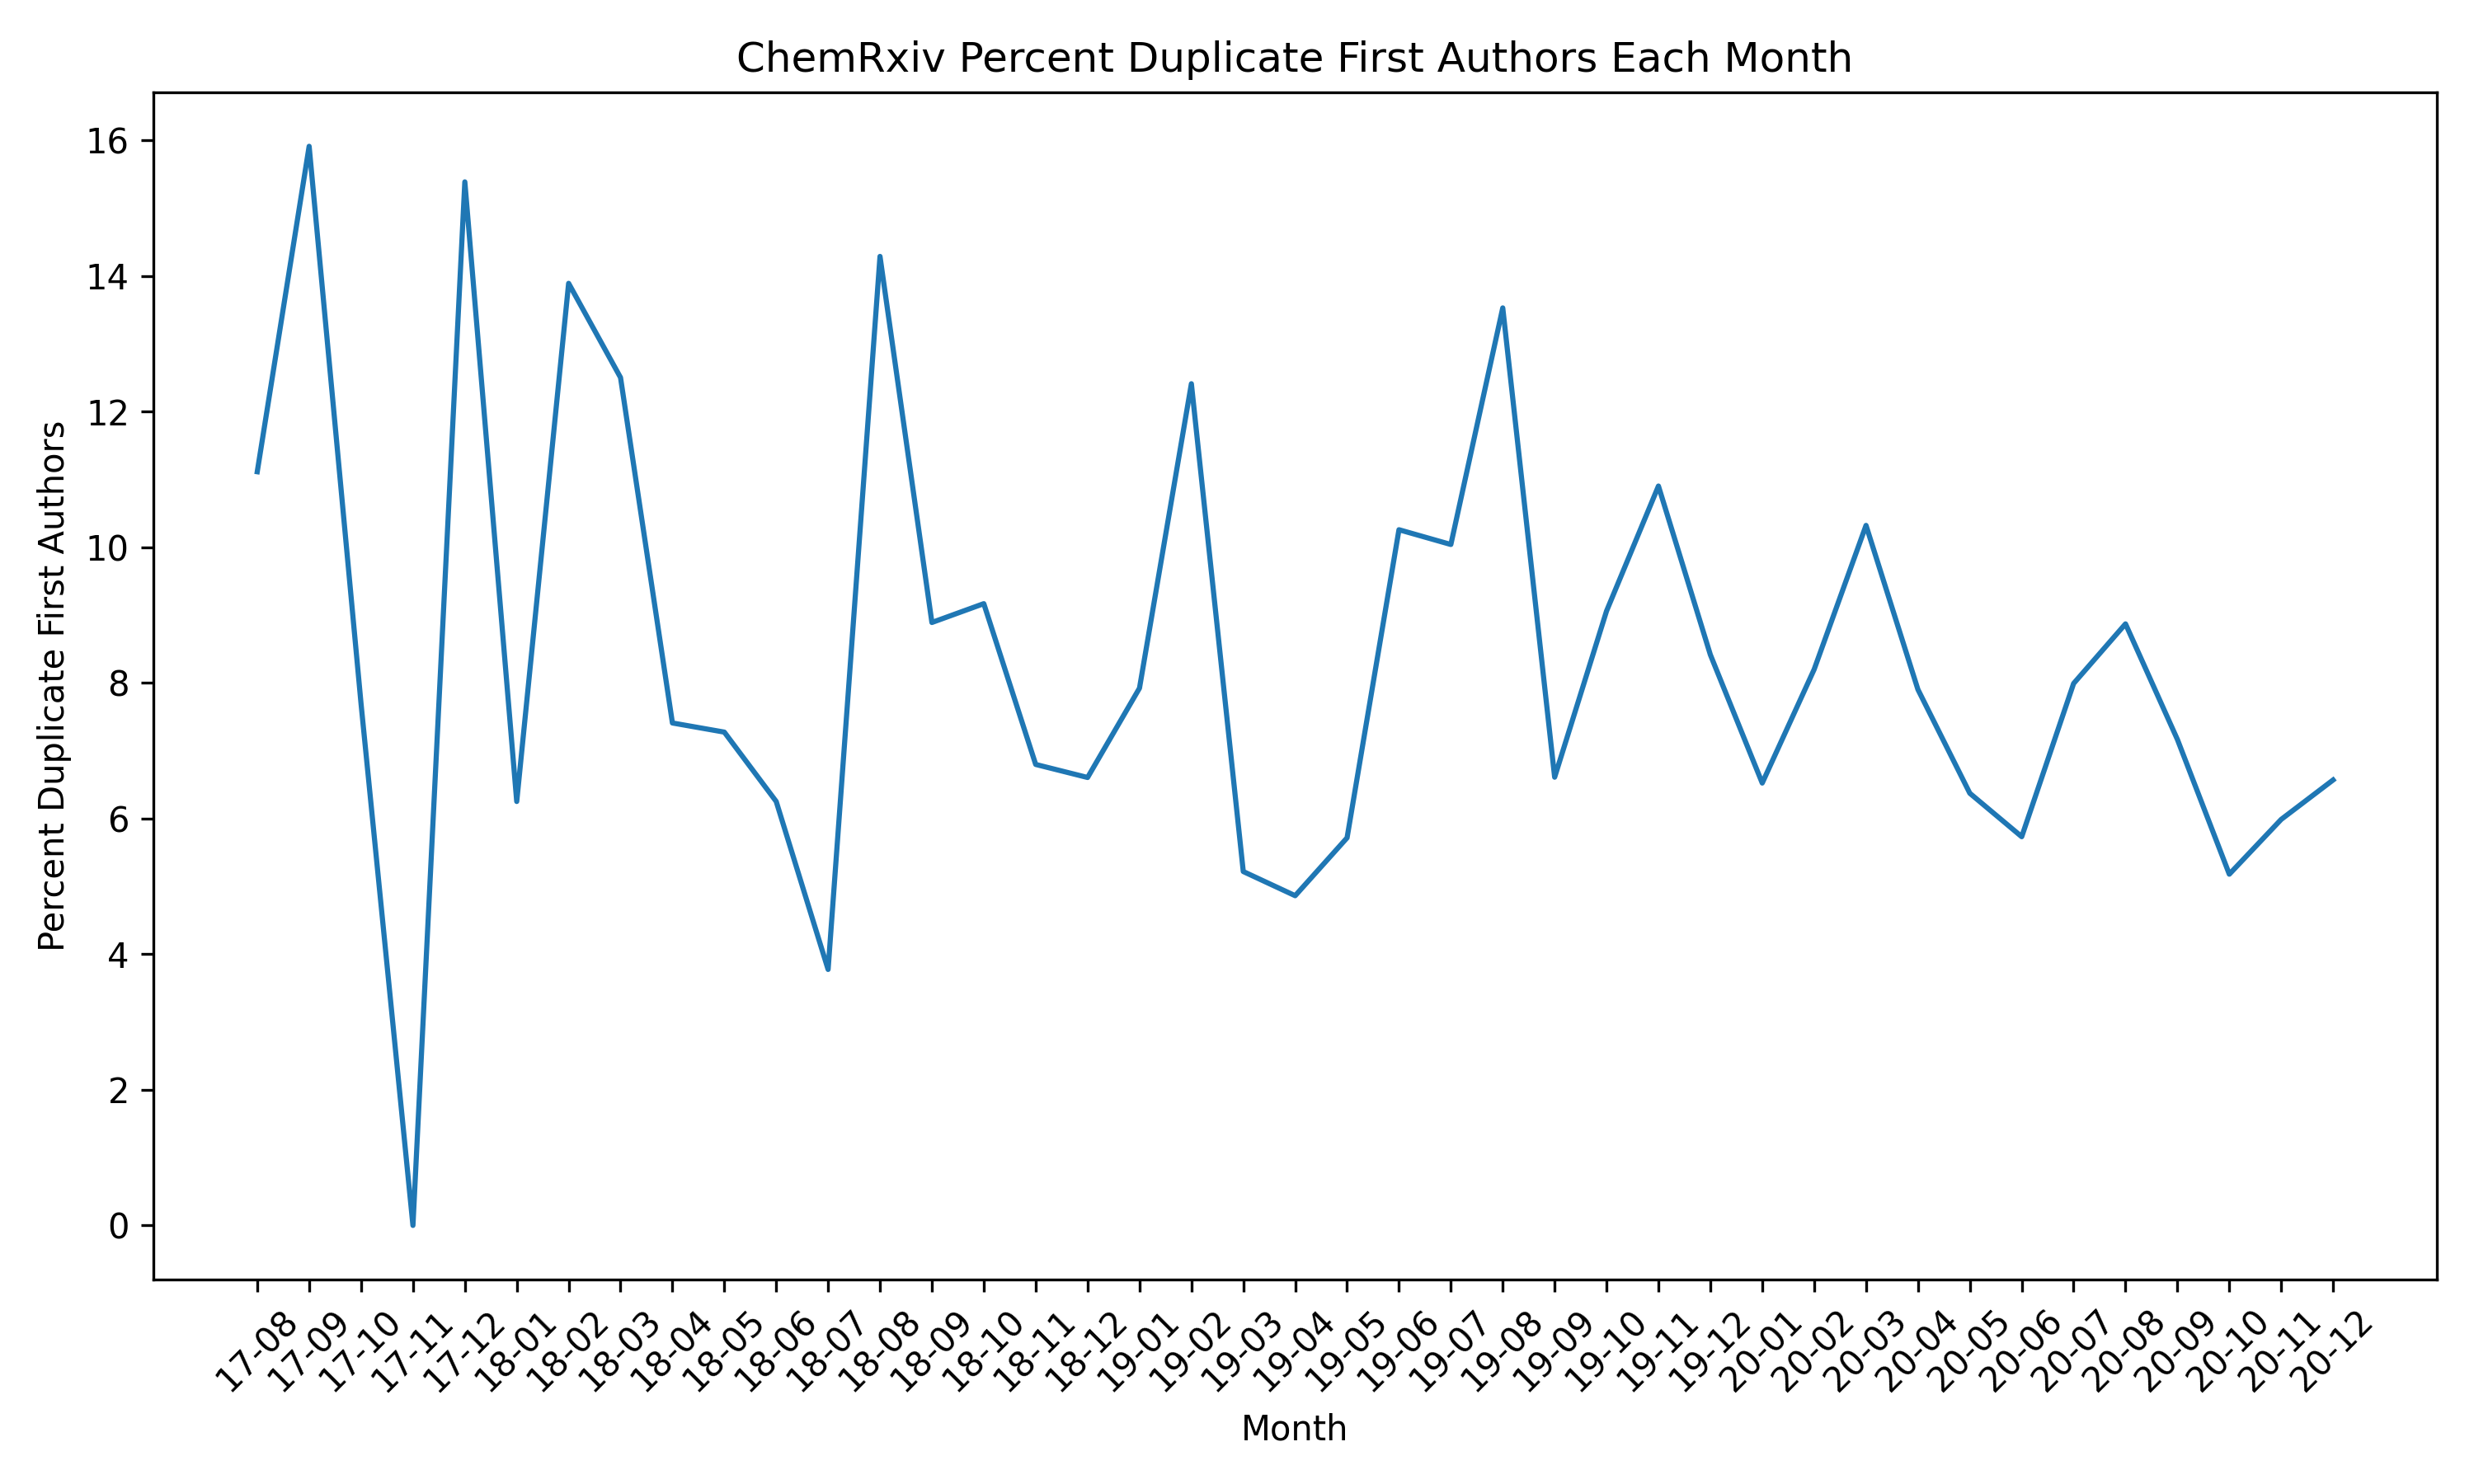
How many author submit multiple times each month?
How many authors submitted more than once per month? This chart shows spikes in August, which I will guess is when most people are submitting before their summer breaks :)
How many authors submitted for their first time each month?
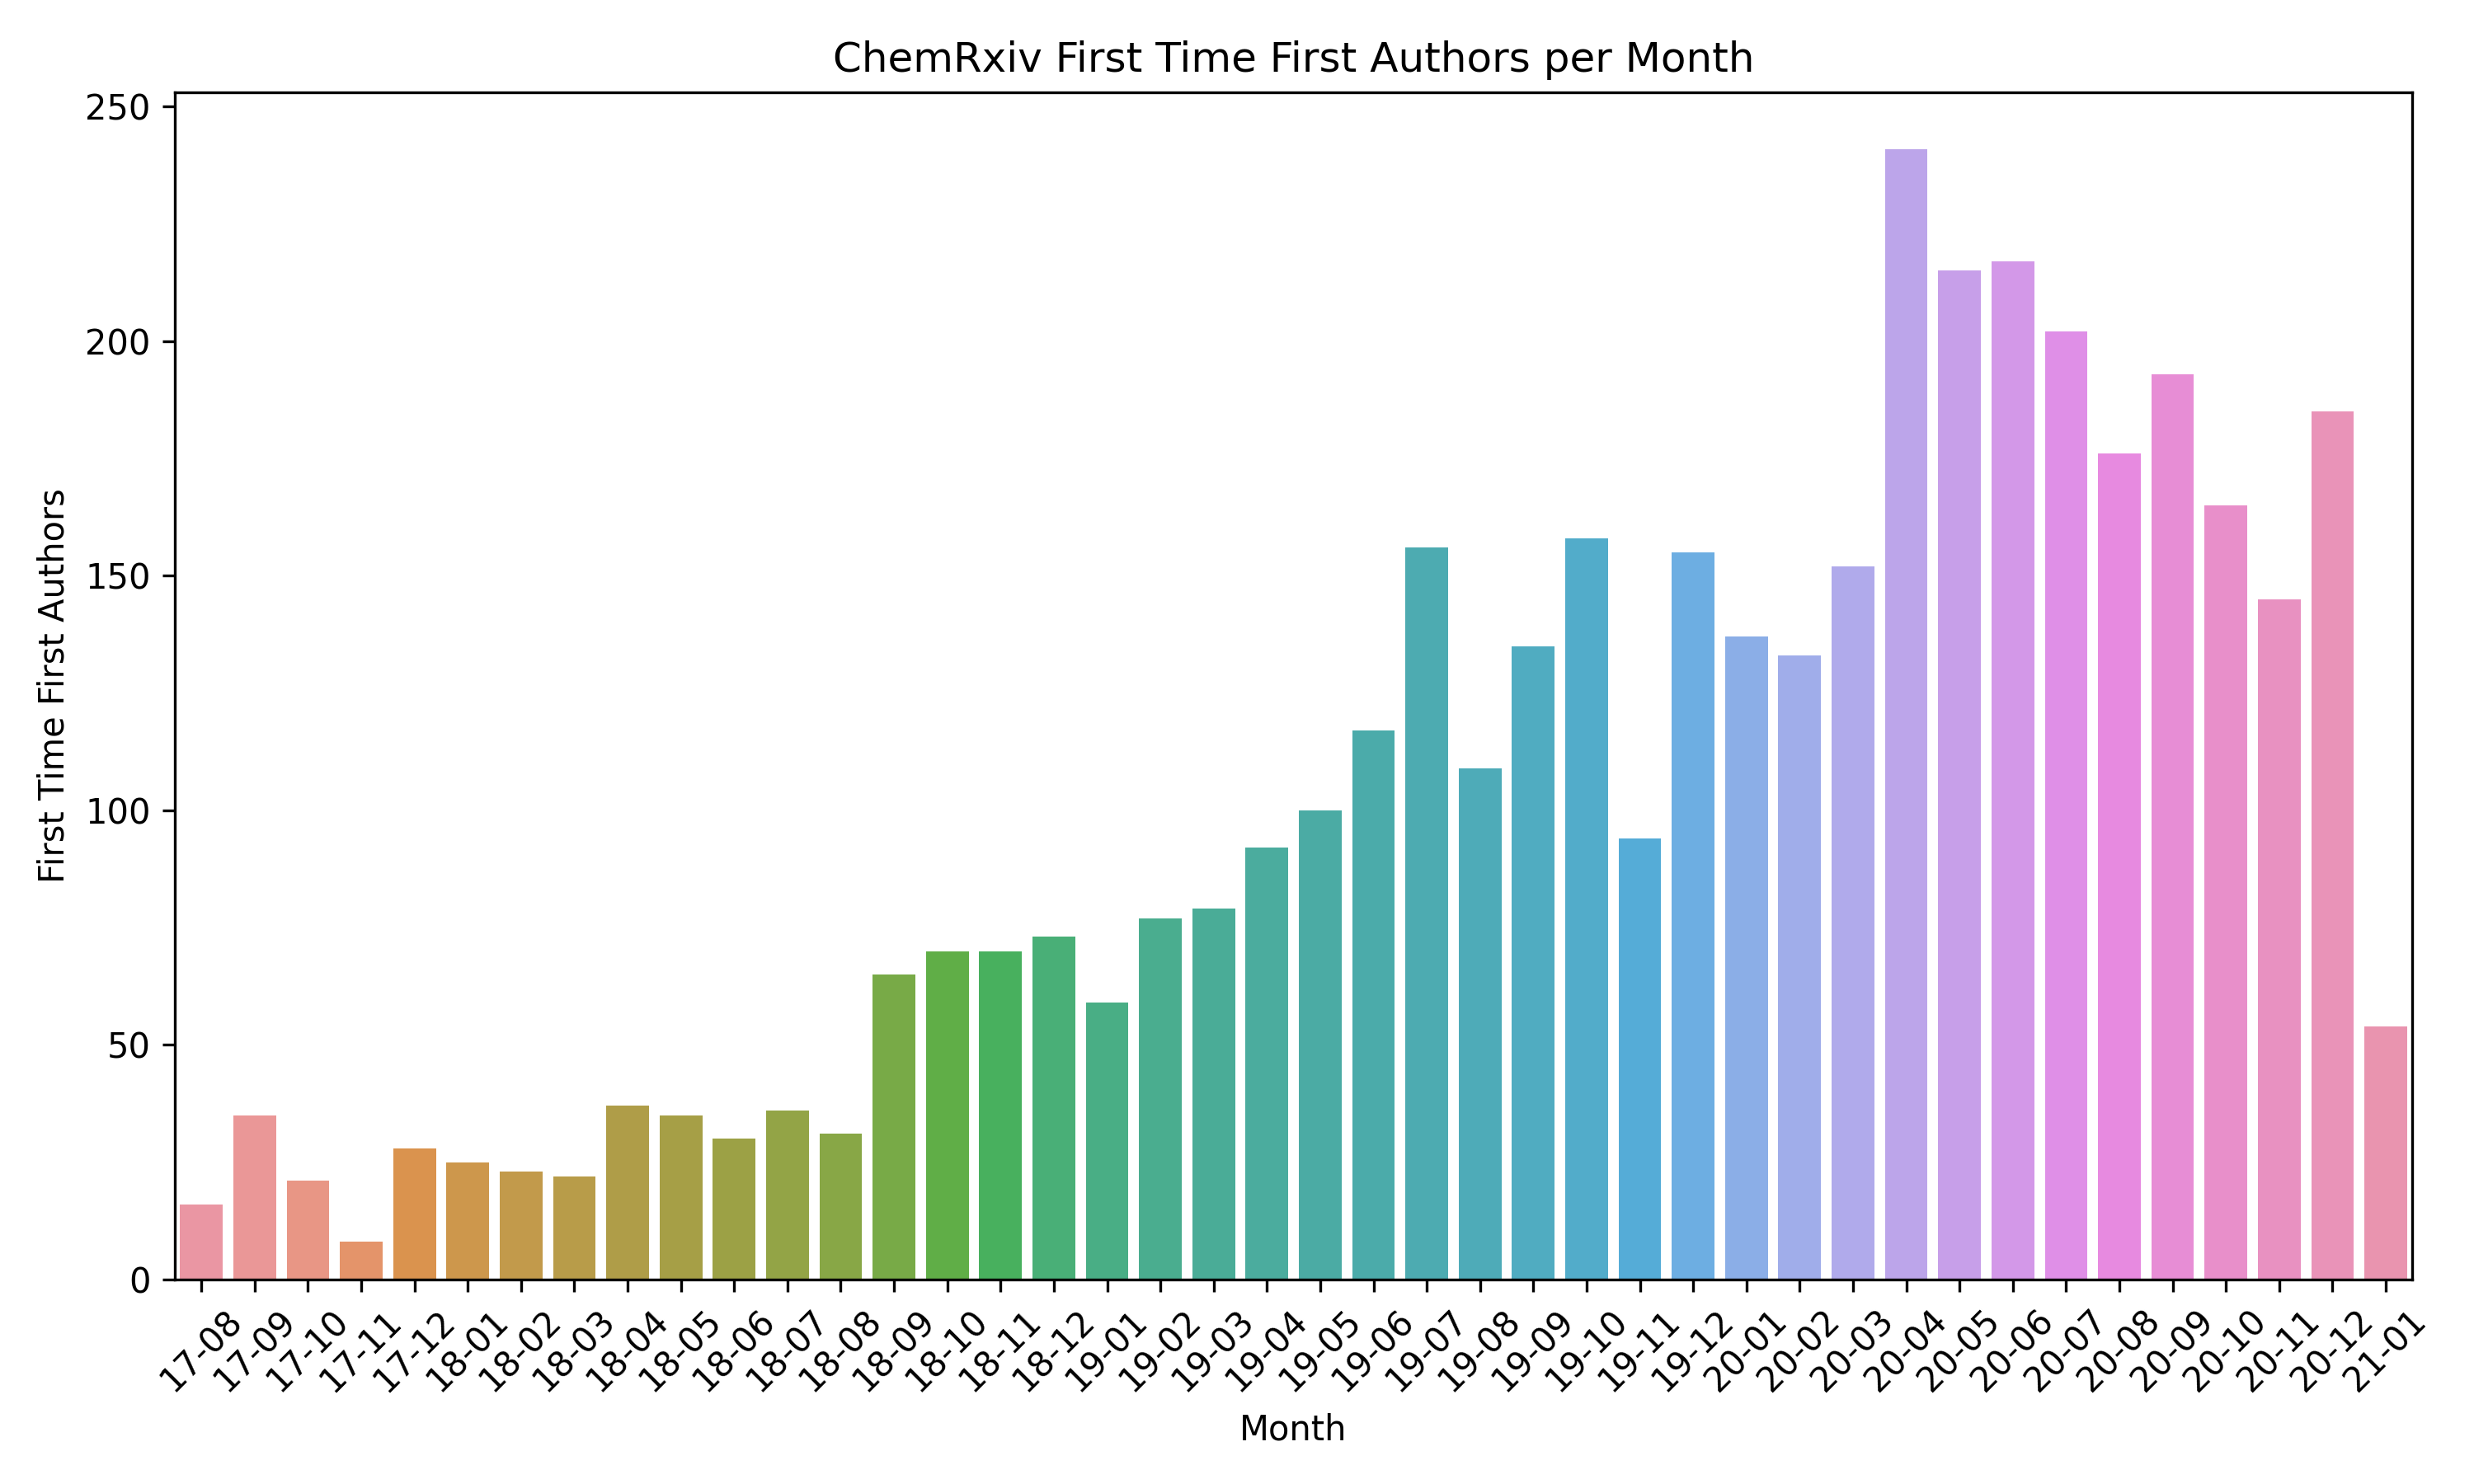
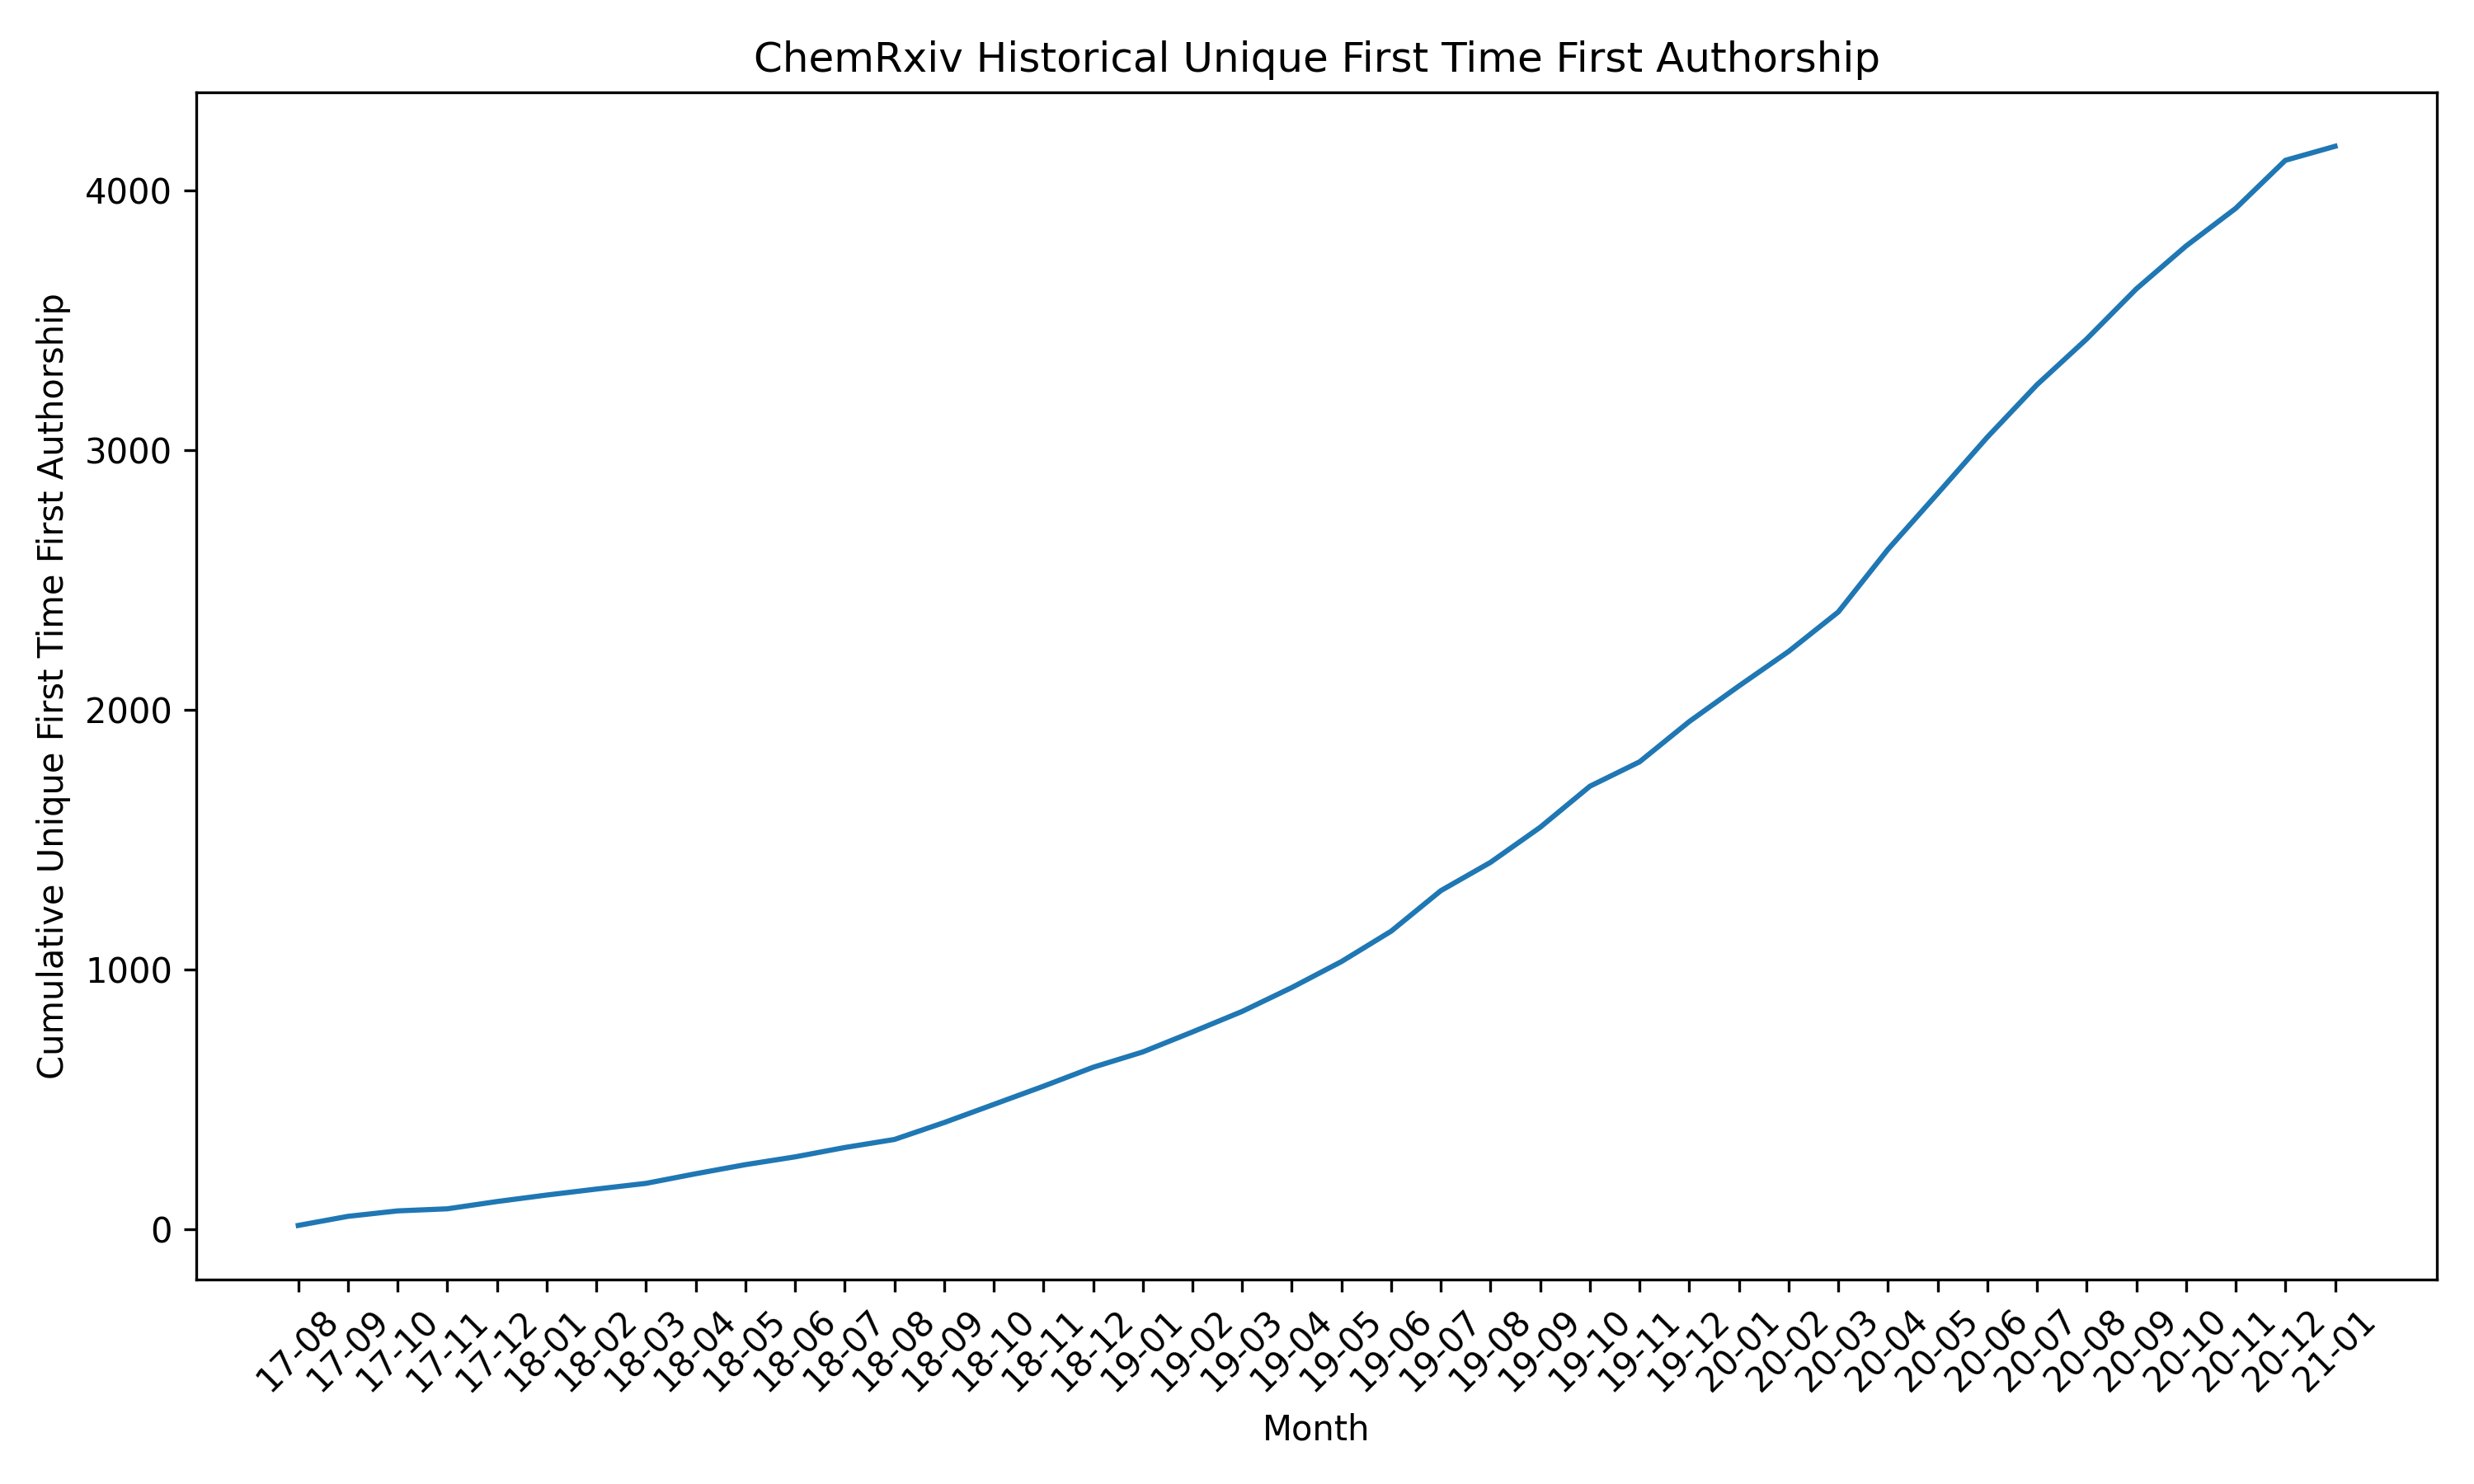
How many unique first authors are there on ChemRxiv?
How many first authors have historically contributed to ChemRxiv at each month? We can take the first date of authorship for each author then count at each month how many unique first time authors there are. Then, we can use a cumulative sum to show how many authors have contributed to ChemRxiv at any point in time.
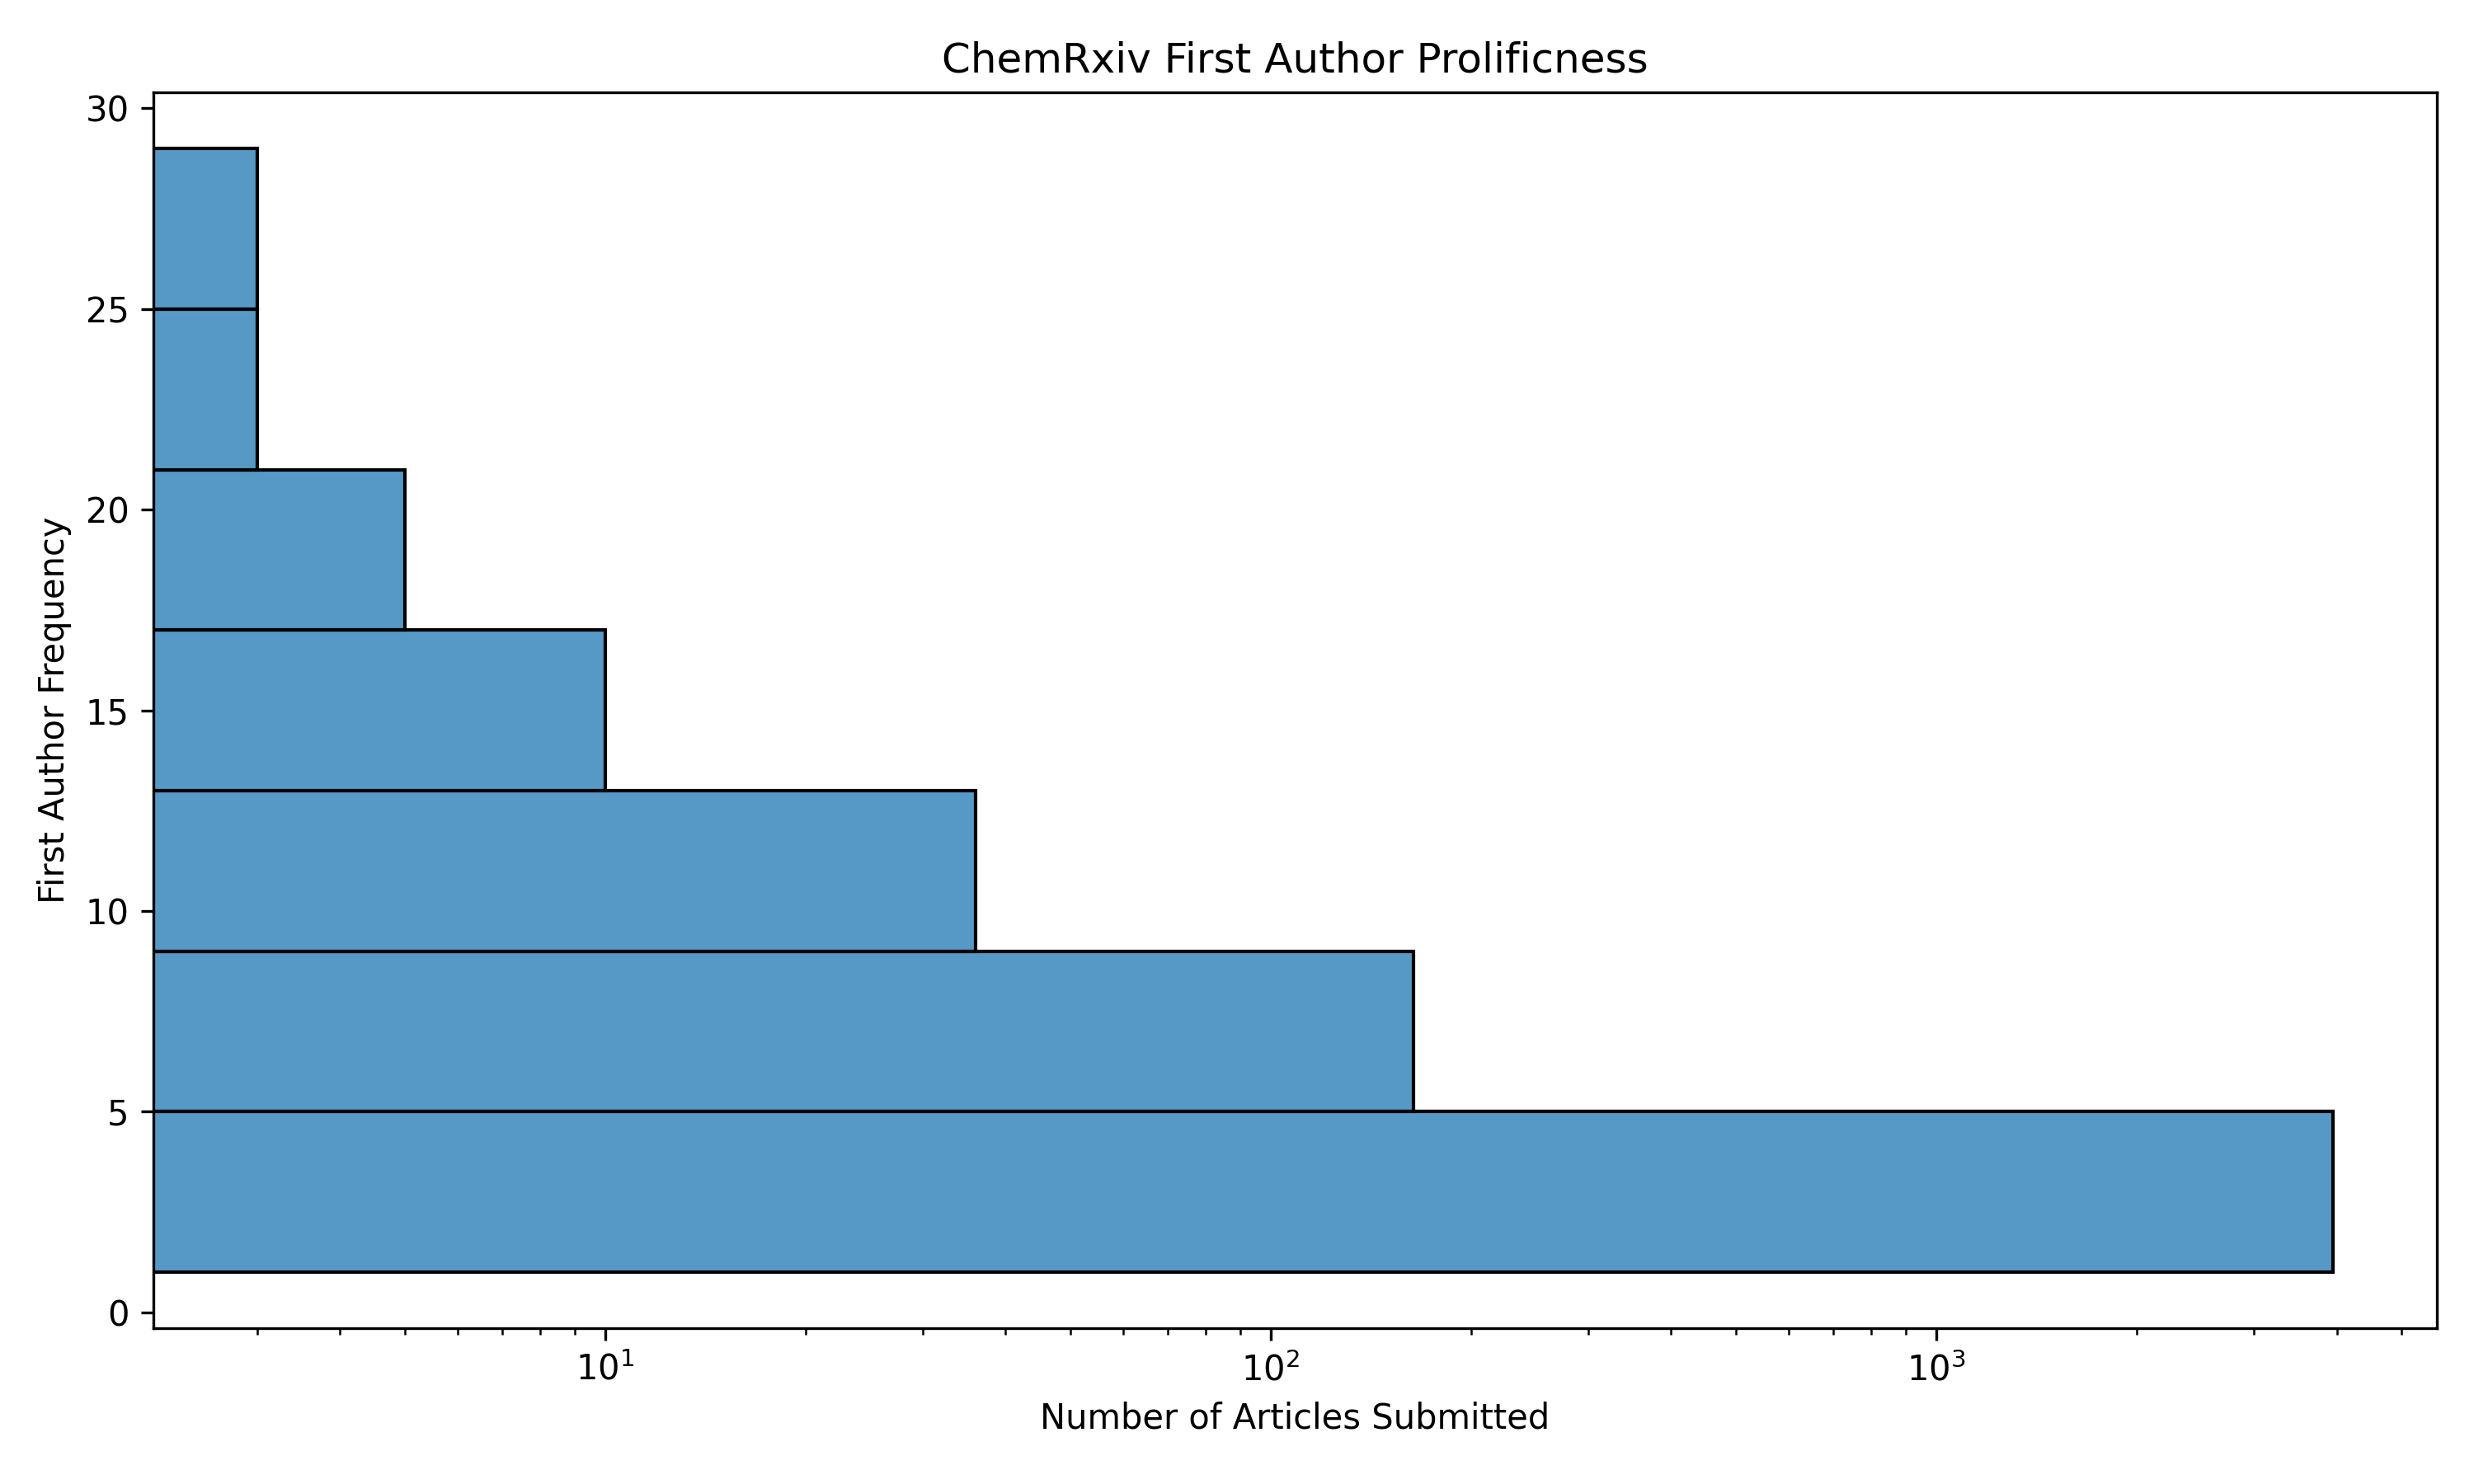
How many authors are prolific on ChemRxiv?
If we aggregate the data, we can ask how many authors have submitted lots of articles:
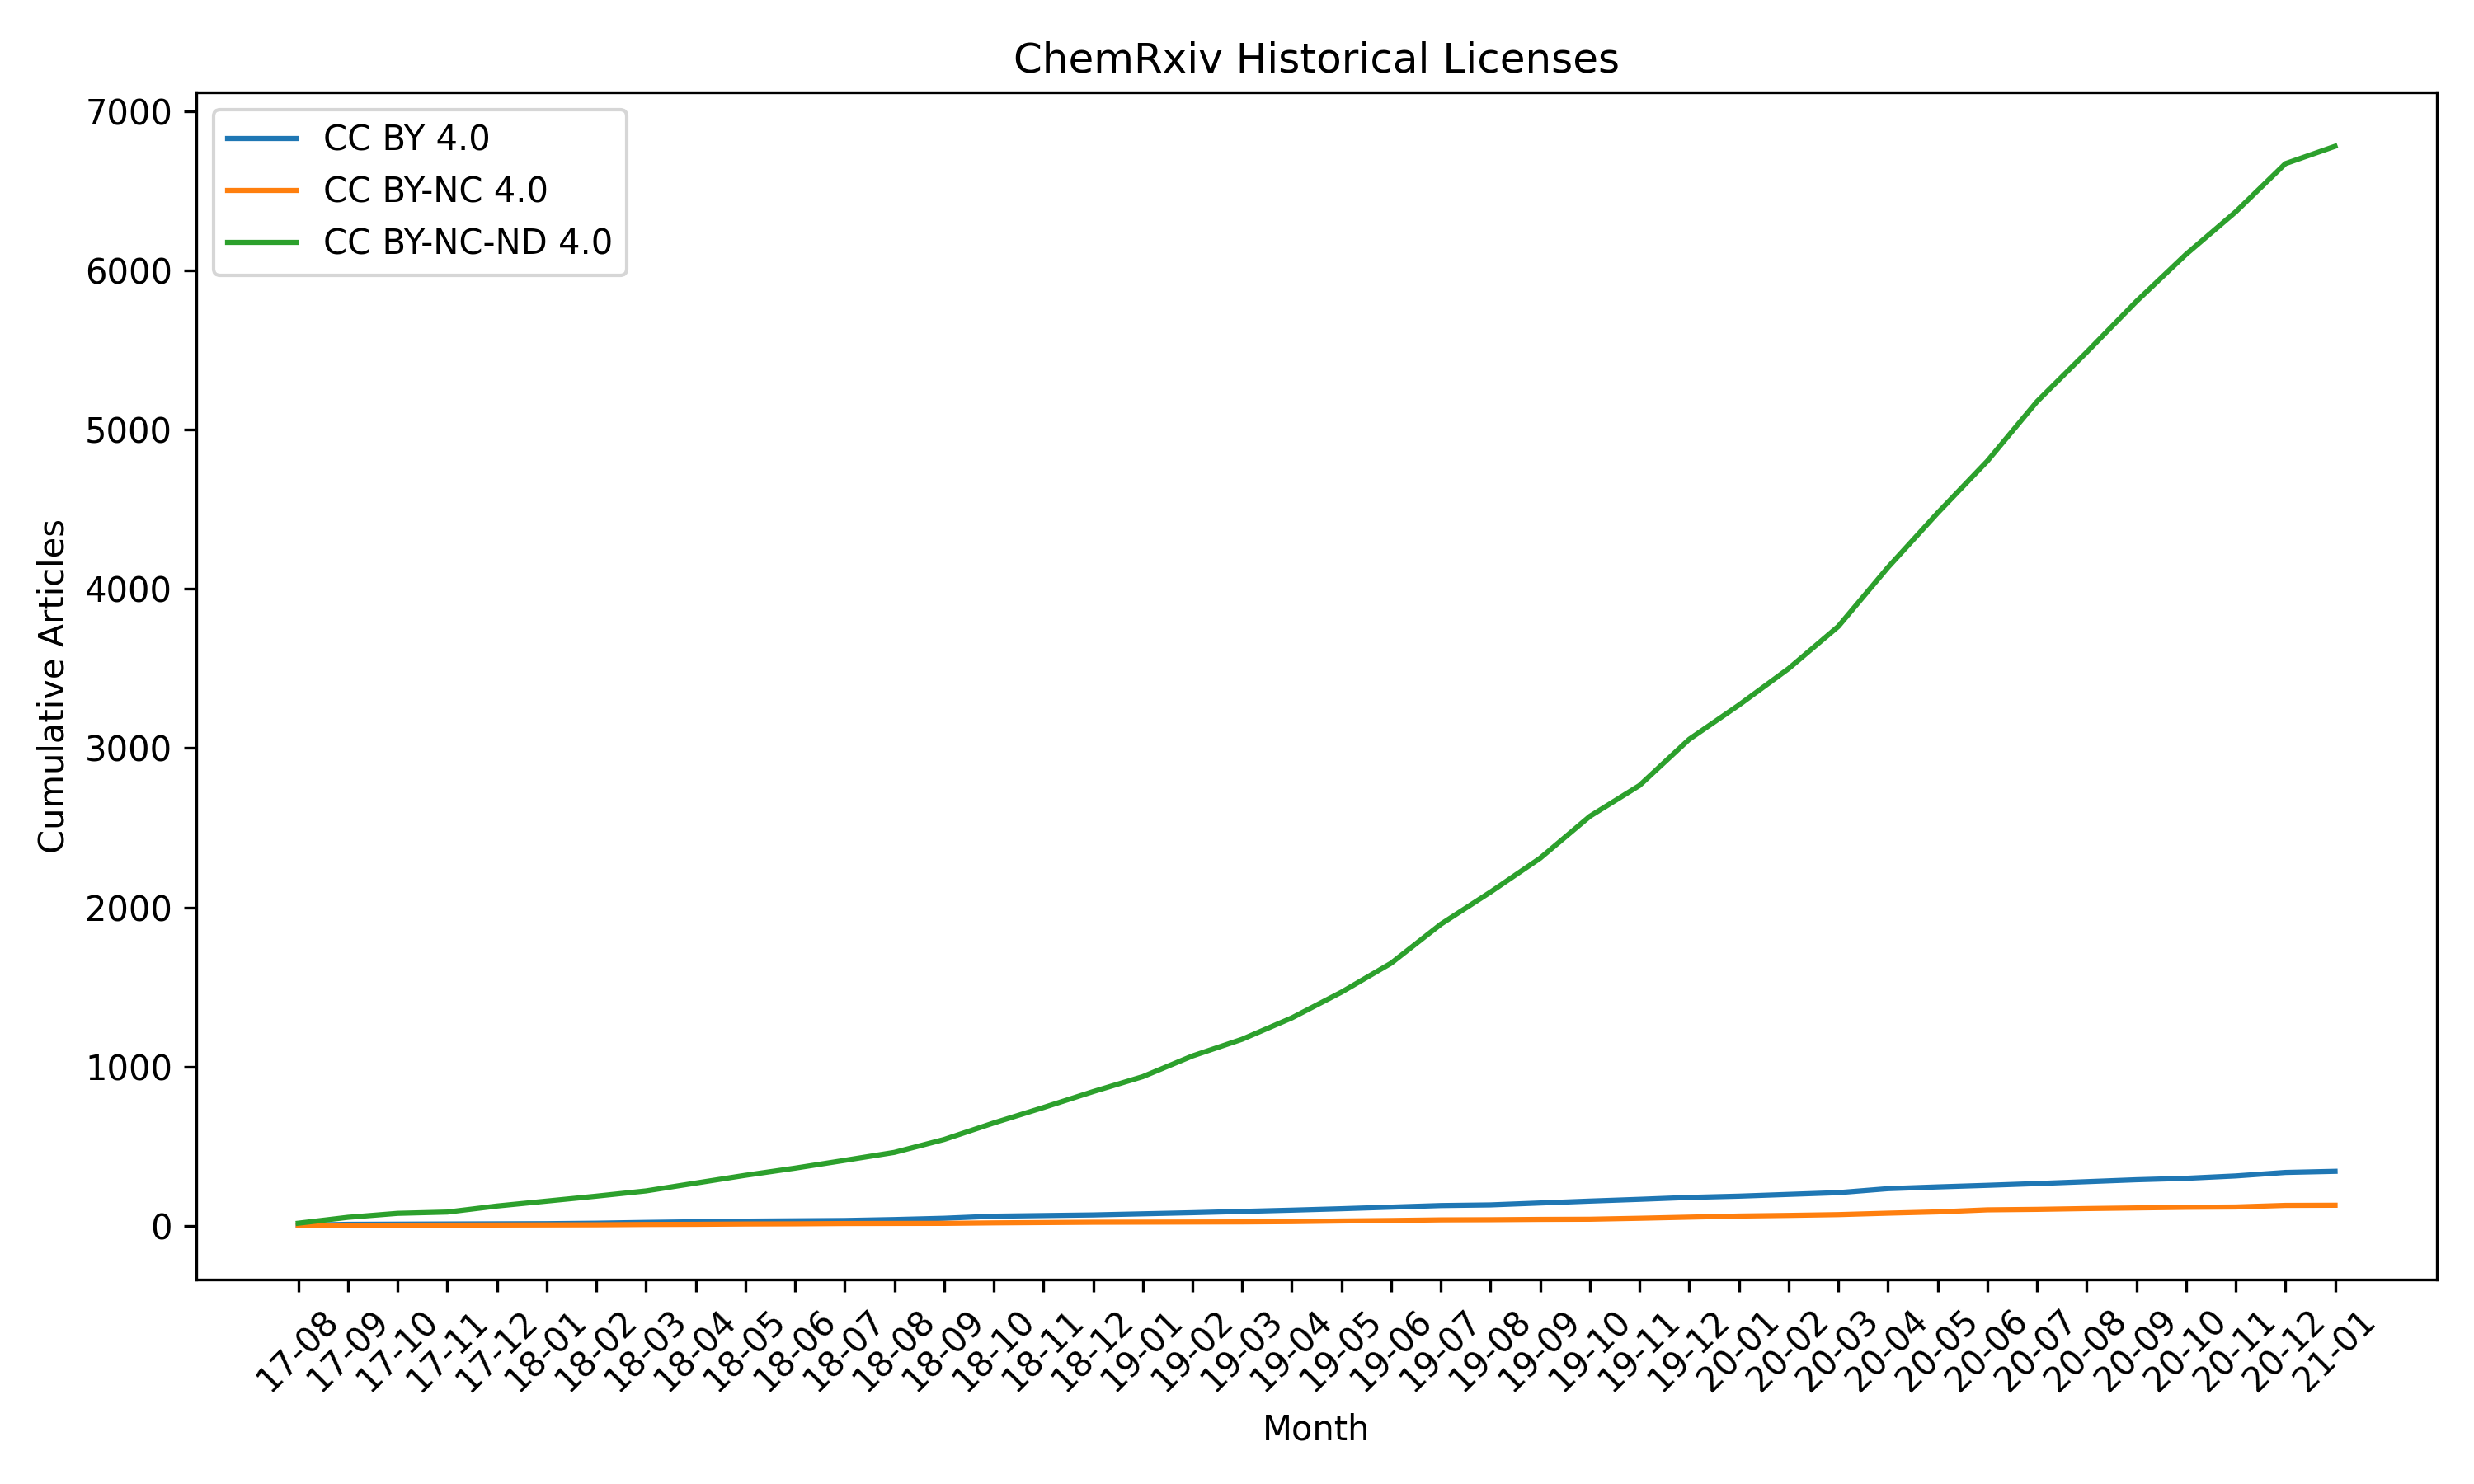
What licenses are popular on ChemRxiv?
The following chart shows the popularity of different licenses over time. The CC BY-NC-ND 4.0 license is a resounding victor. You can learn about Creative Commons (CC) licenses here.
If you’re interested to regenerate these charts yourself, you’re welcome to do so with the following code:
git clone https://github.com/cthoyt/chemrxiv-summarize
cd chemrxiv-summarize
python 01_download.py
python 02_process.py
python 03_visualize.py
Downloading takes a bit of time (about 40 minutes) but there’s a tqdm bar to
keep you entertained in the mean time. Normally I package all of my code, but
the one off scripts here didn’t seem to warrant it.
As a final note, I’d like to shout out to Marshall Brennan (@Organometallica) for being an excellent spokesperson and public face of ChemRxiv. Also, throughout this process I realized he also was a chemistry major in his bachelor’s at Northeastern University like me. Go huskies!
May 2020 Update: François-Xavier Coudert created the ChemRxiv-Dashboard, which makes some similar summaries to this. Check it out!
I made a dashboard for @ChemRxiv, fed by the @figshare
— FX Coudert (@fxcoudert) May 19, 2020
metadata API.https://t.co/rKyAOGkrVO pic.twitter.com/fLfjEabraz
November 2020 Update: I added a license chart and made some changes to enable this repo to be much more easily used for other FigShare institutions. If you’ve found this post from @figshare’s tweet and want help making these charts for your FigShare institution, please feel free to @ me on Twitter or send me an email.