Scoring Inverse Triples
When training a knowledge graph embedding model with inverse triples, two scores
are learned for every triple (h, r, t) - one for the original and one for the
inverse triple (t, r', h). This blog post is about investigating when/why
there might be meaningful differences between those scores depending on the
dataset, model, and training assumption.
In PyKEEN, each interaction model (e.g.,
TransE, ConvE, Tucker) inherits from the base model pykeen.models.Model and
implements the scoring methods Model.score_h(), Model.score_r(),
Model.score_t(), and Model.score_hrt(). The last, score_hrt() takes in a
triple or sequence of triples and calculates a real-valued score for each. This
is quite efficient in batch because of the way most models are implemented with
matrix multiplication in PyTorch. The remaining three take pairs:
score_h()takes relation/tail pairs and provides scores across all possible tailsscore_r()takes head/tail pairs and provides scores across all possible relationsscore_t()takes head/relation pair and provides scores across all possible heads
Each of these functions are used slightly differently during the training and
inference workflows. One of the reviewers for the
PyKEEN software paper pointed out that the
while Model.predict_scores_all_tails() and Model.predict_scores_all_heads()
inference workflows allow the user to choose if the forward triples or inverse
triples are used for predictions, that this functionality is not exposed to the
user for use in further study.
Mehdi (@mali-git; he’s a really good guy) began
pykeen/pykeen#208 refactoring the
implementation of the head prediction and tail prediction workflows in the
pykeen.model.Model base model class that better abstracted the operations for
generating inverse triples, and how they are applied in each inference workflow.
I often serve the role of project manager for PyKEEN, so I was initially a bit skeptical of adding new functionality without some good examples of what a user might do with it. After a bit of discussion, Mehdi suggested we could showcase a comparison the distributions of forward and inverse triples scores and provided a minimal example. While he was busy actually working on the implementation, I took his example to the extreme and created an entire experimental setup for this investigation to accompany the new implementation.
Comparison of Distributions
Medhi provided a new implementation of Model.score_hrt_inverse for exactly
this kind of investigation. The following code can be used to get the scores for
the testing triples from the Nations dataset.
from pykeen.datasets import Nations
from pykeen.pipeline import pipeline

nations = Nations()
testing_triples = nations.testing.mapped_triples

res = pipeline(
    dataset=nations,
    model='RotatE',
    training_loop='LCWA',
    training_kwargs=dict(num_epochs=60),
)

# Score with original triples
scores_forward = res.model.score_hrt(testing_triples)

# Score with inverse triples
scores_inverse = res.model.score_hrt_inverse(testing_triples)
These results are both PyTorch tensors, so don’t forget to use
scores_*.detach().numpy() for use in your own comparisons and visualizations.
The first thing I did was plotted the distributions of both with
seaborn.histplot.
The following two plots show that sometimes the distributions match up pretty well, and sometimes they don’t. The distributions are shown normalized to make it easier to compare - the shapes are more important than the actual counts because the number of testing triples changes from dataset to dataset. Sorry about the inconsistency in bin widths - I’ve tried a lot and haven’t figured it out. If you know the solution, please let me know (or make a PR to PyKEEN for ultimate PR cred).
| Nations | Kinships |
|---|---|
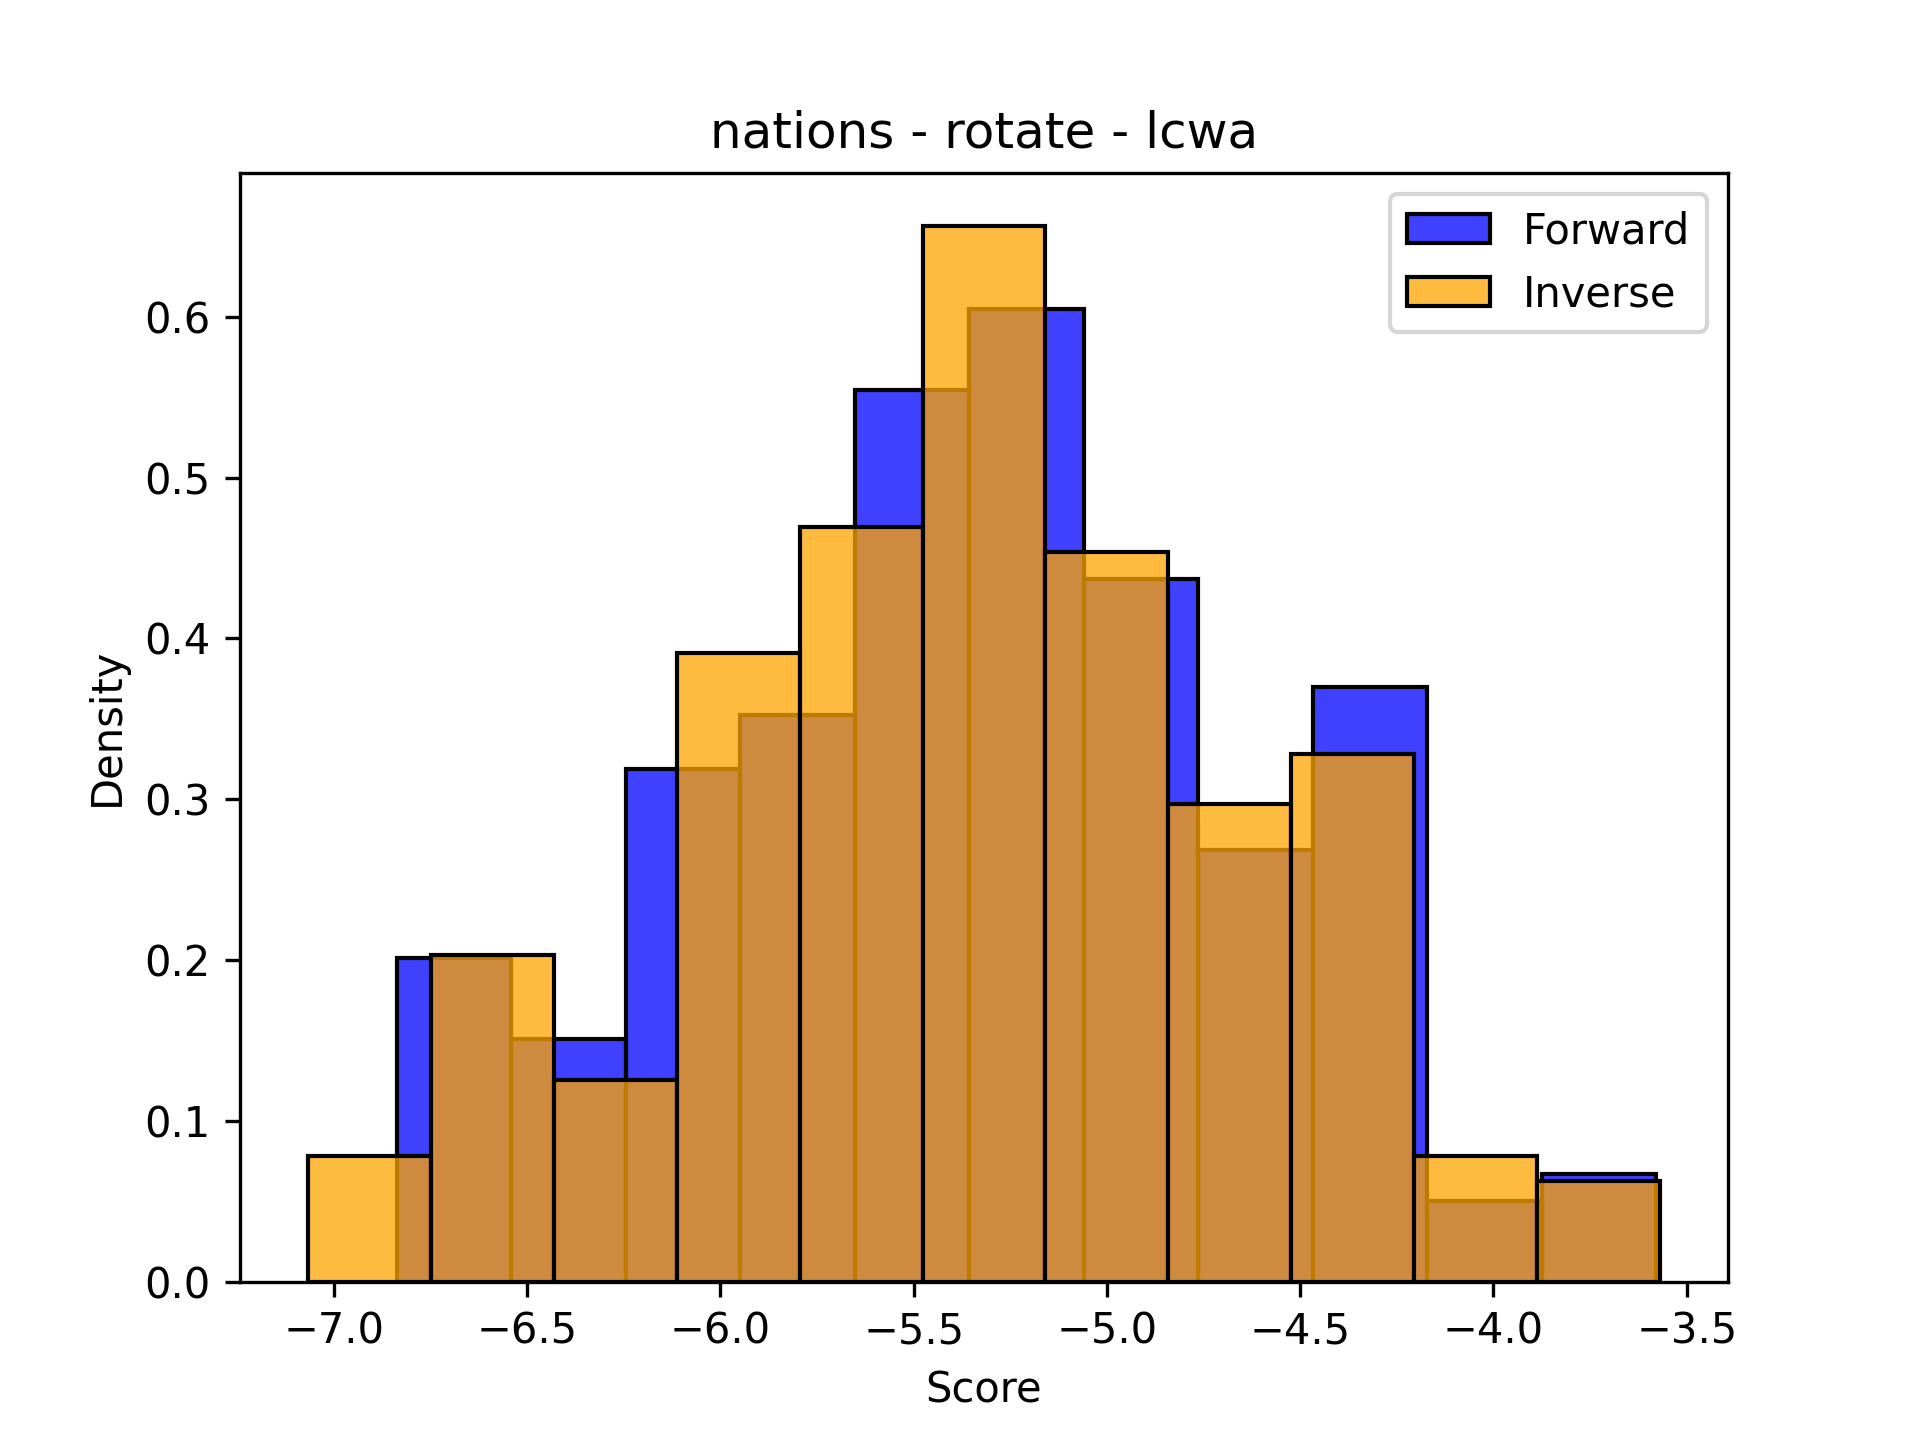 |
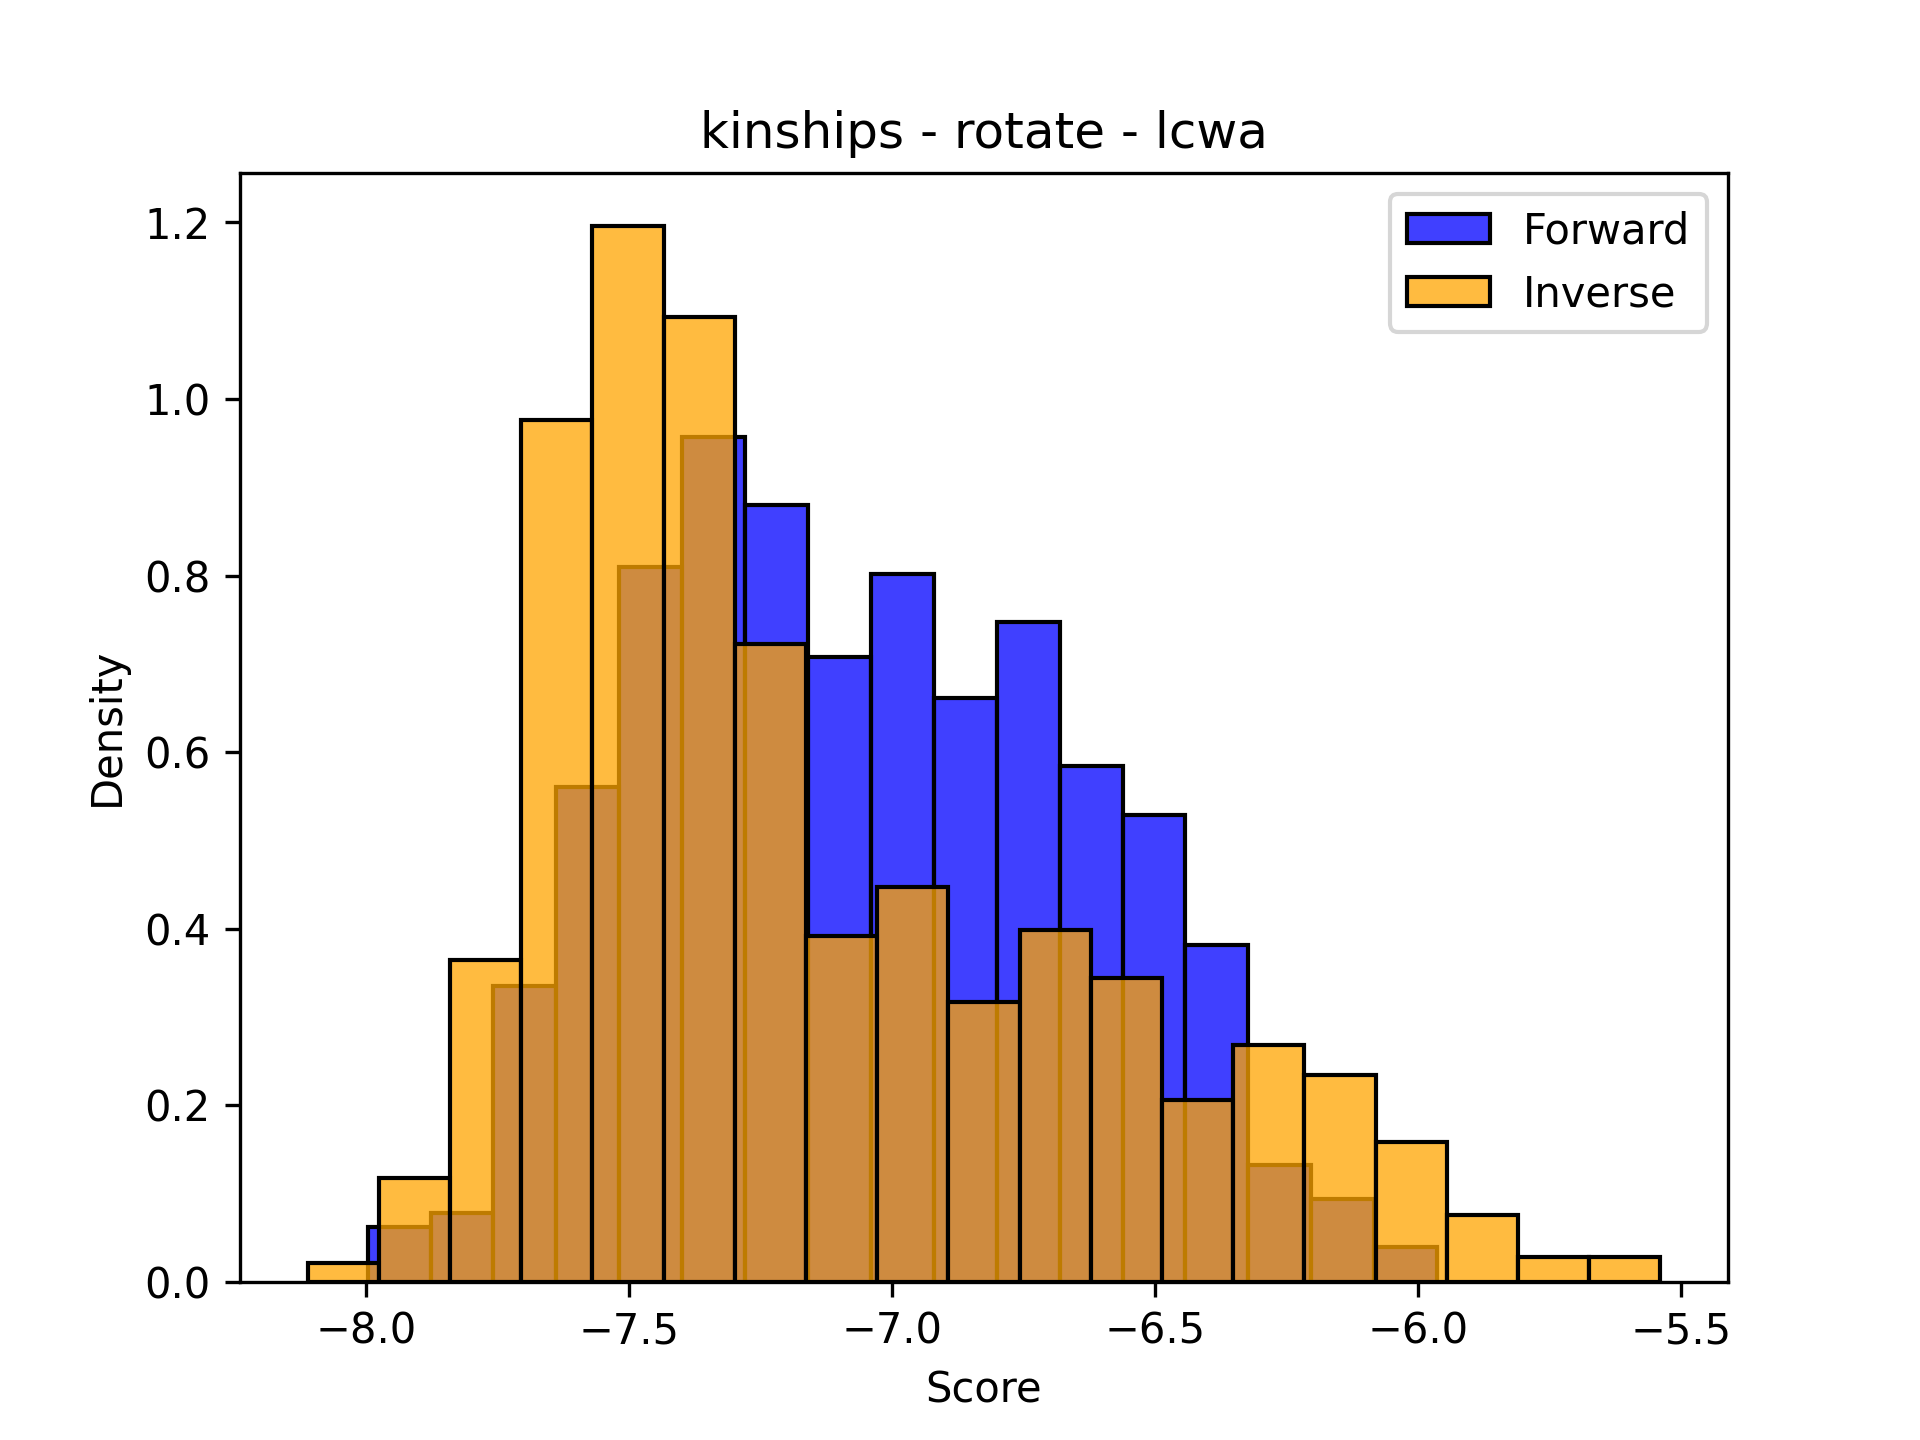 |
This was just one comparison for the same model/training assumption. In order to make it possible to look at many facets at the same time, the data need to be simplified. Because the scores have a pairwise correspondence (the same triple was scored two ways), it makes sense to plot distribution of residuals (the forward score minus the inverse score). Here’s the same plots simplified with residuals:
| Nations | Kinships |
|---|---|
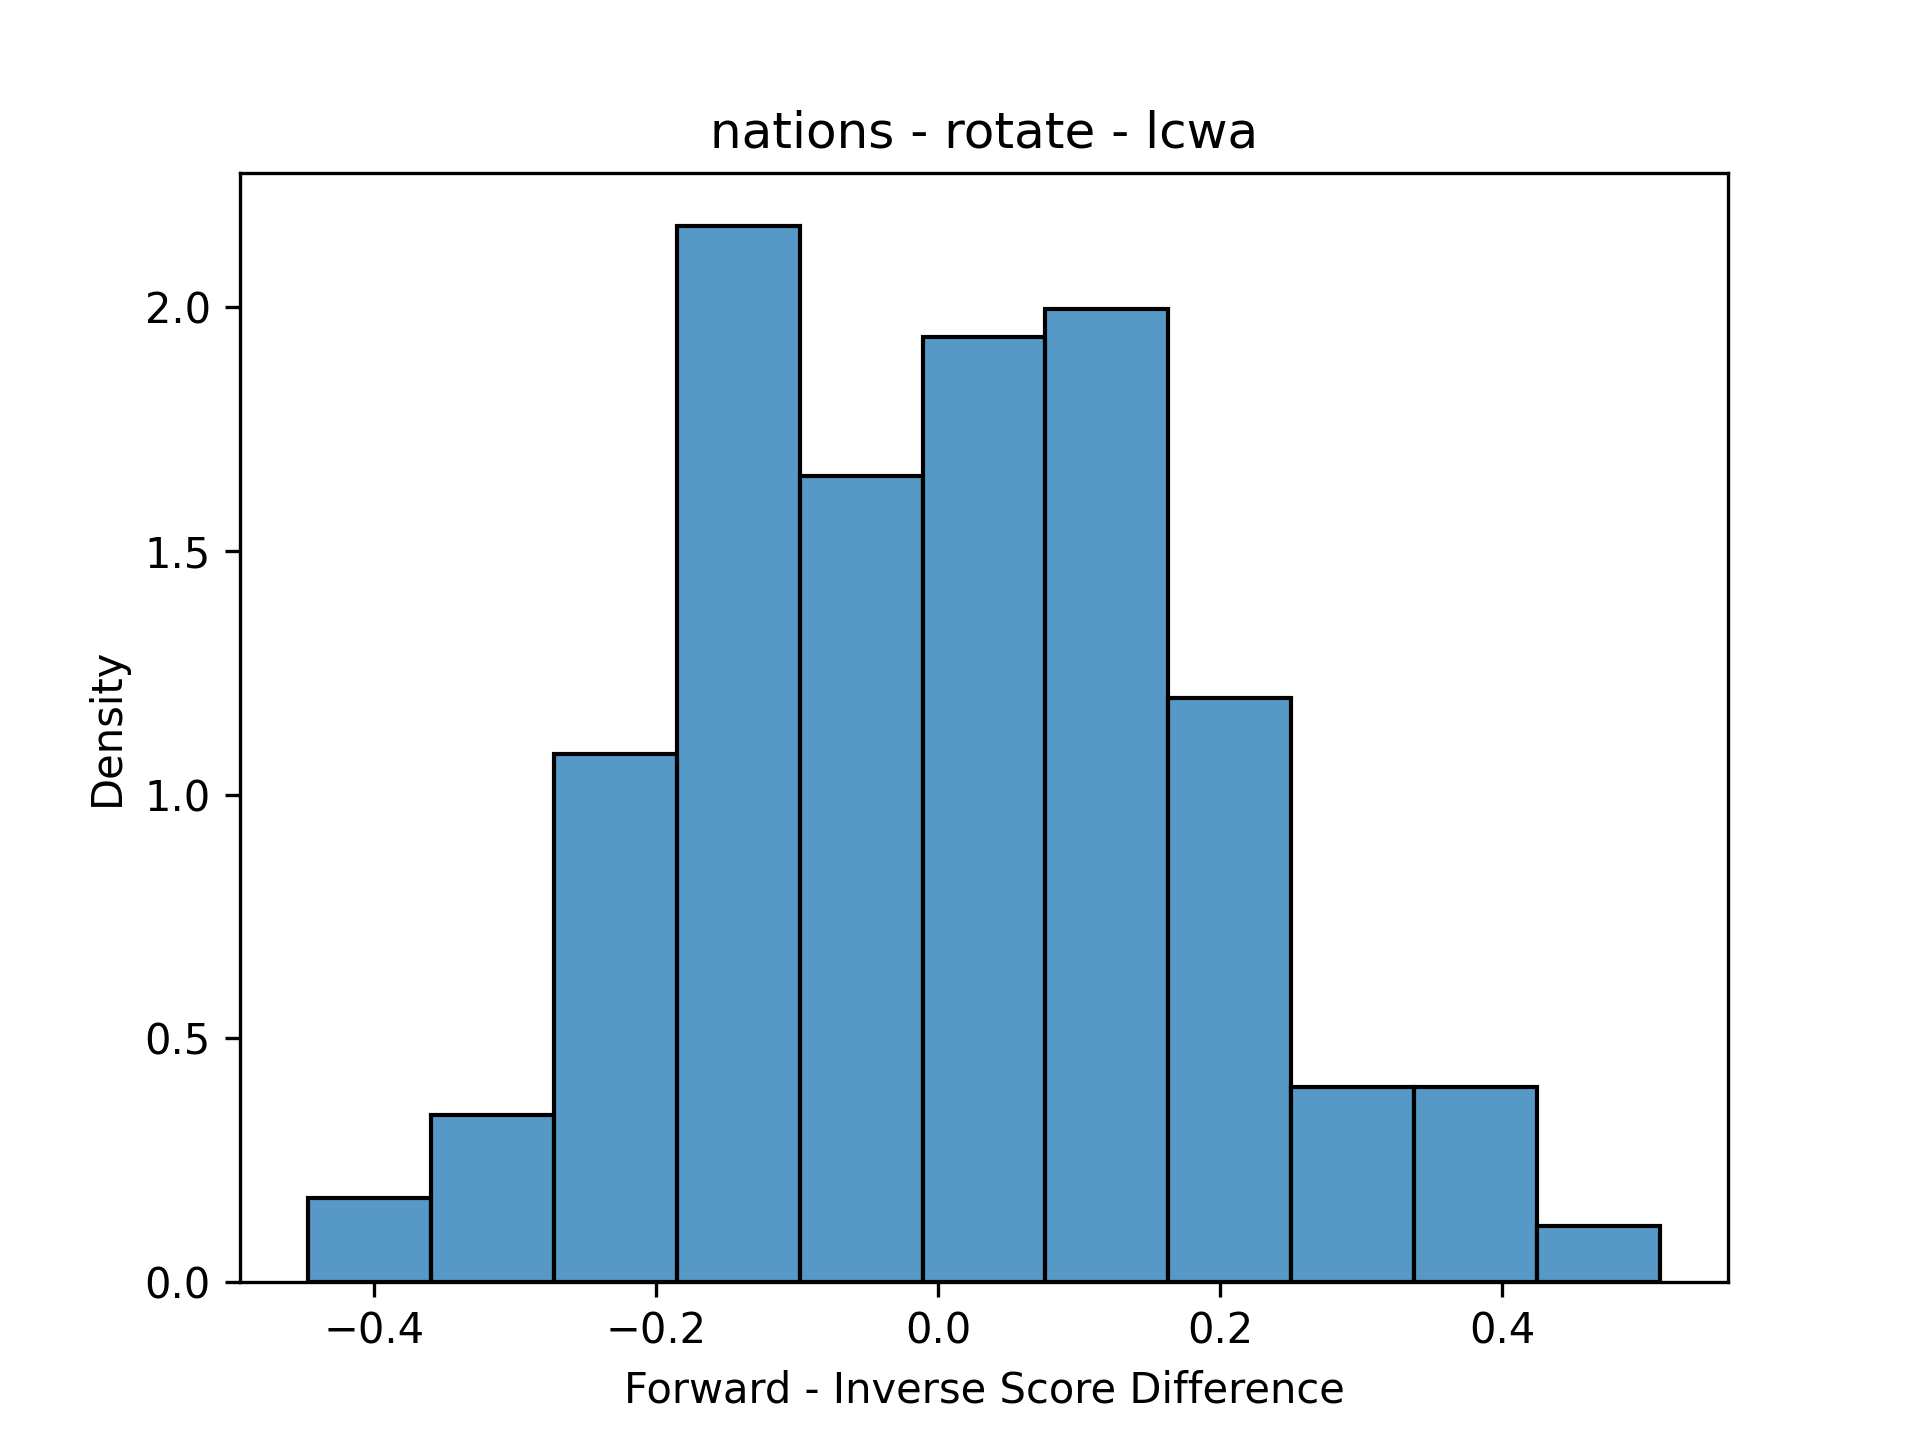 |
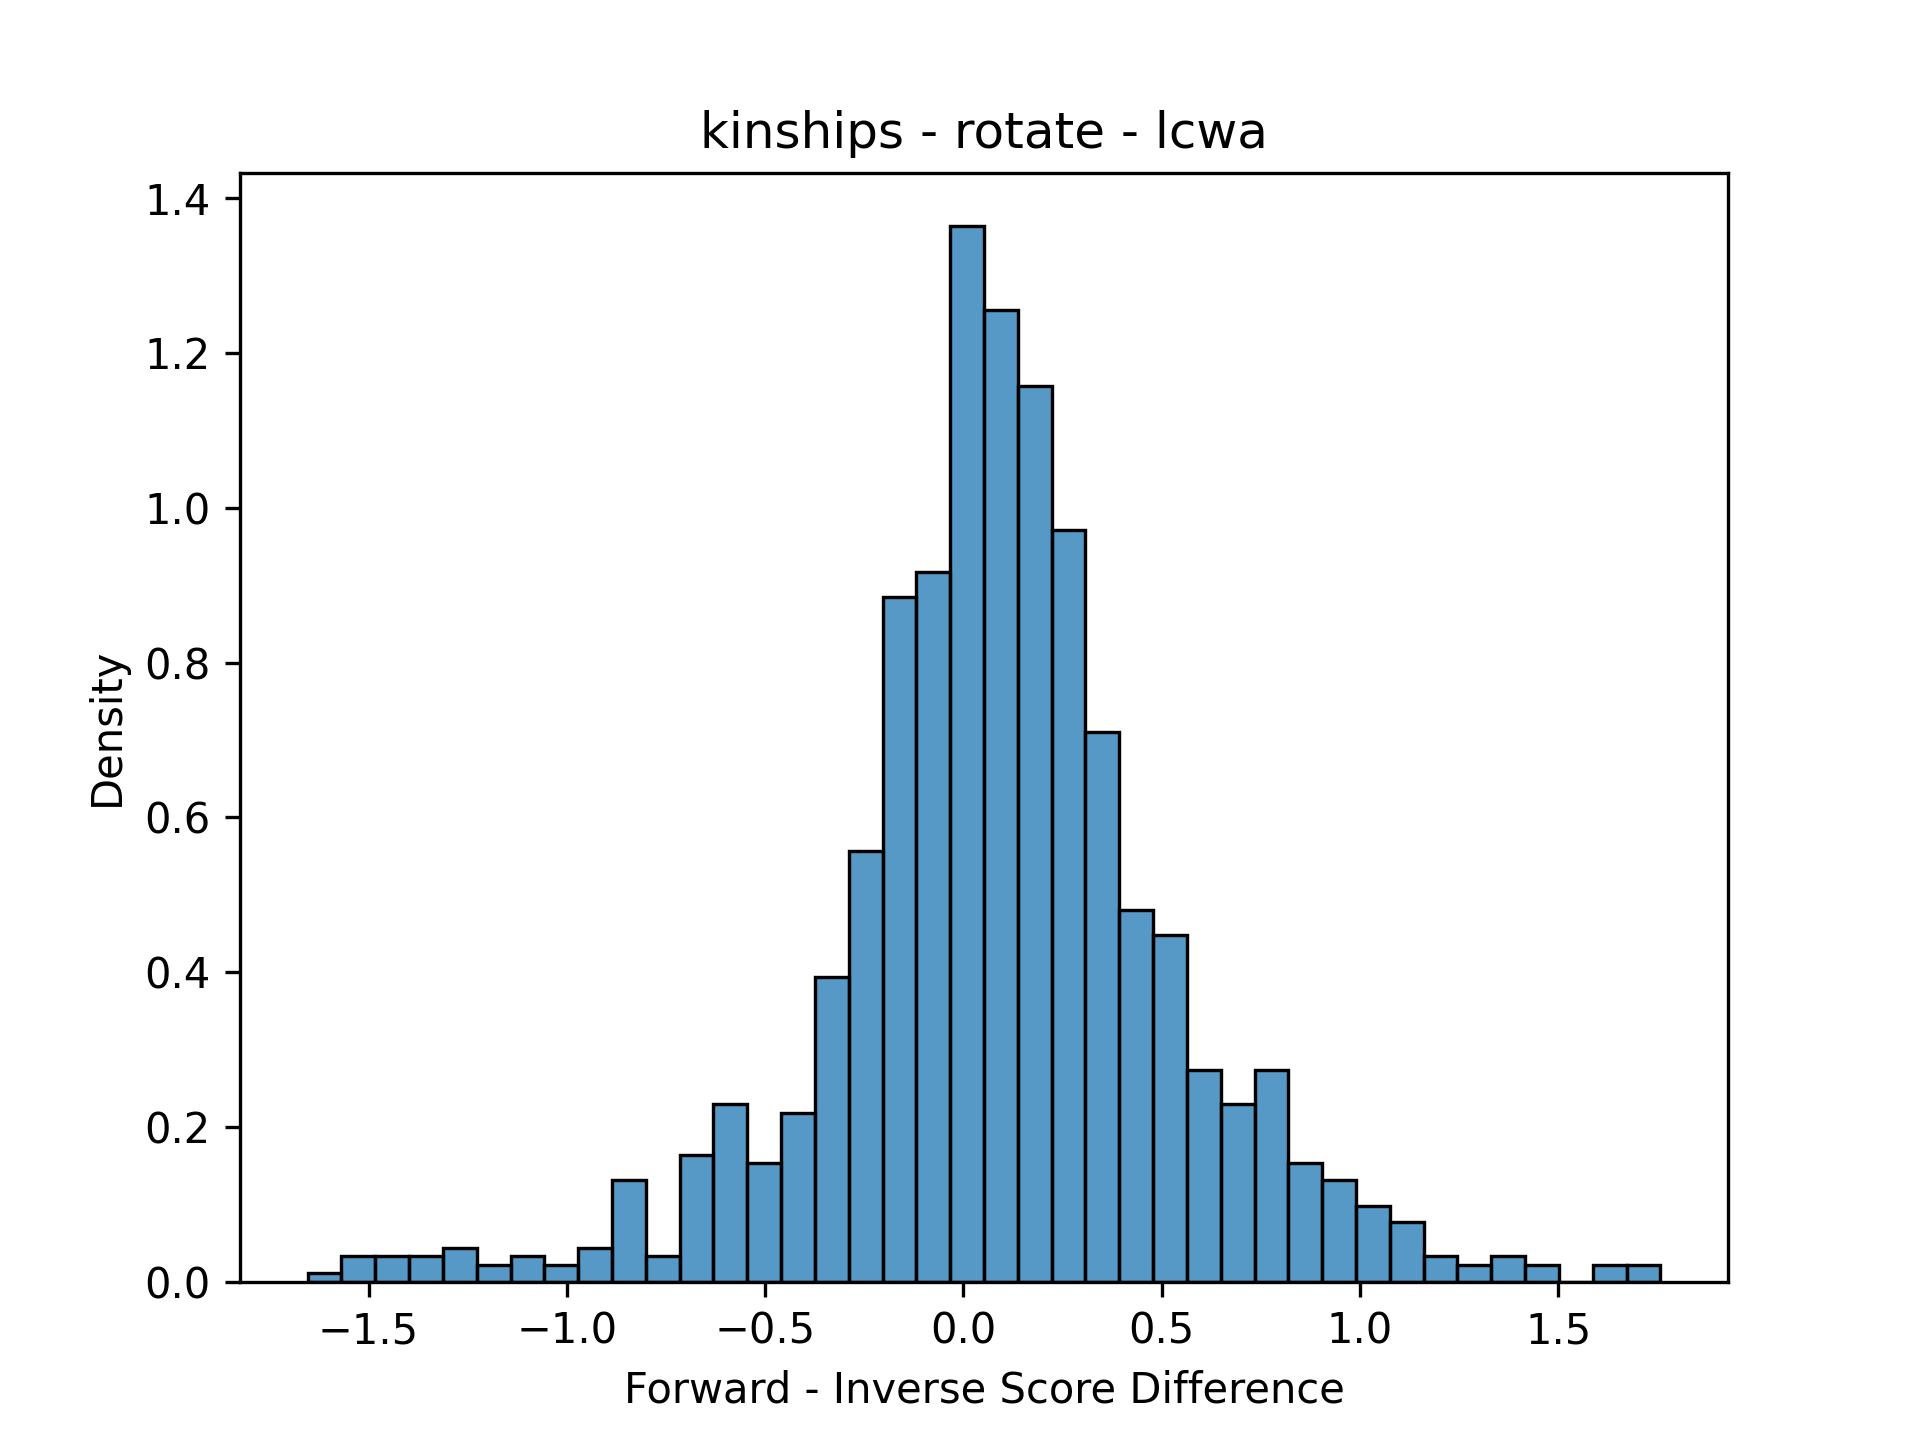 |
The PyKEEN core team is a very special place - Max, Mehdi, and Laurent are all
excellent machine learning researchers and scientists. The part where I excel is
in organization and software development, so I’ve taken care of aspects like the
pipeline(), visualization, and data science aspects of our work. Naturally, I
gravitate towards any tasks that can be solved with super deep loops. So without
further ado, below are presented the results from the script that runs this
experiment for all datasets, models, and training assumptions. It assigns row by
dataset, column by model, and color by training assumption. Note: the score axes
will not be share because each model produces different ranges of scores with
different density functions. This itself is also an interesting and upcoming
avenue of research!
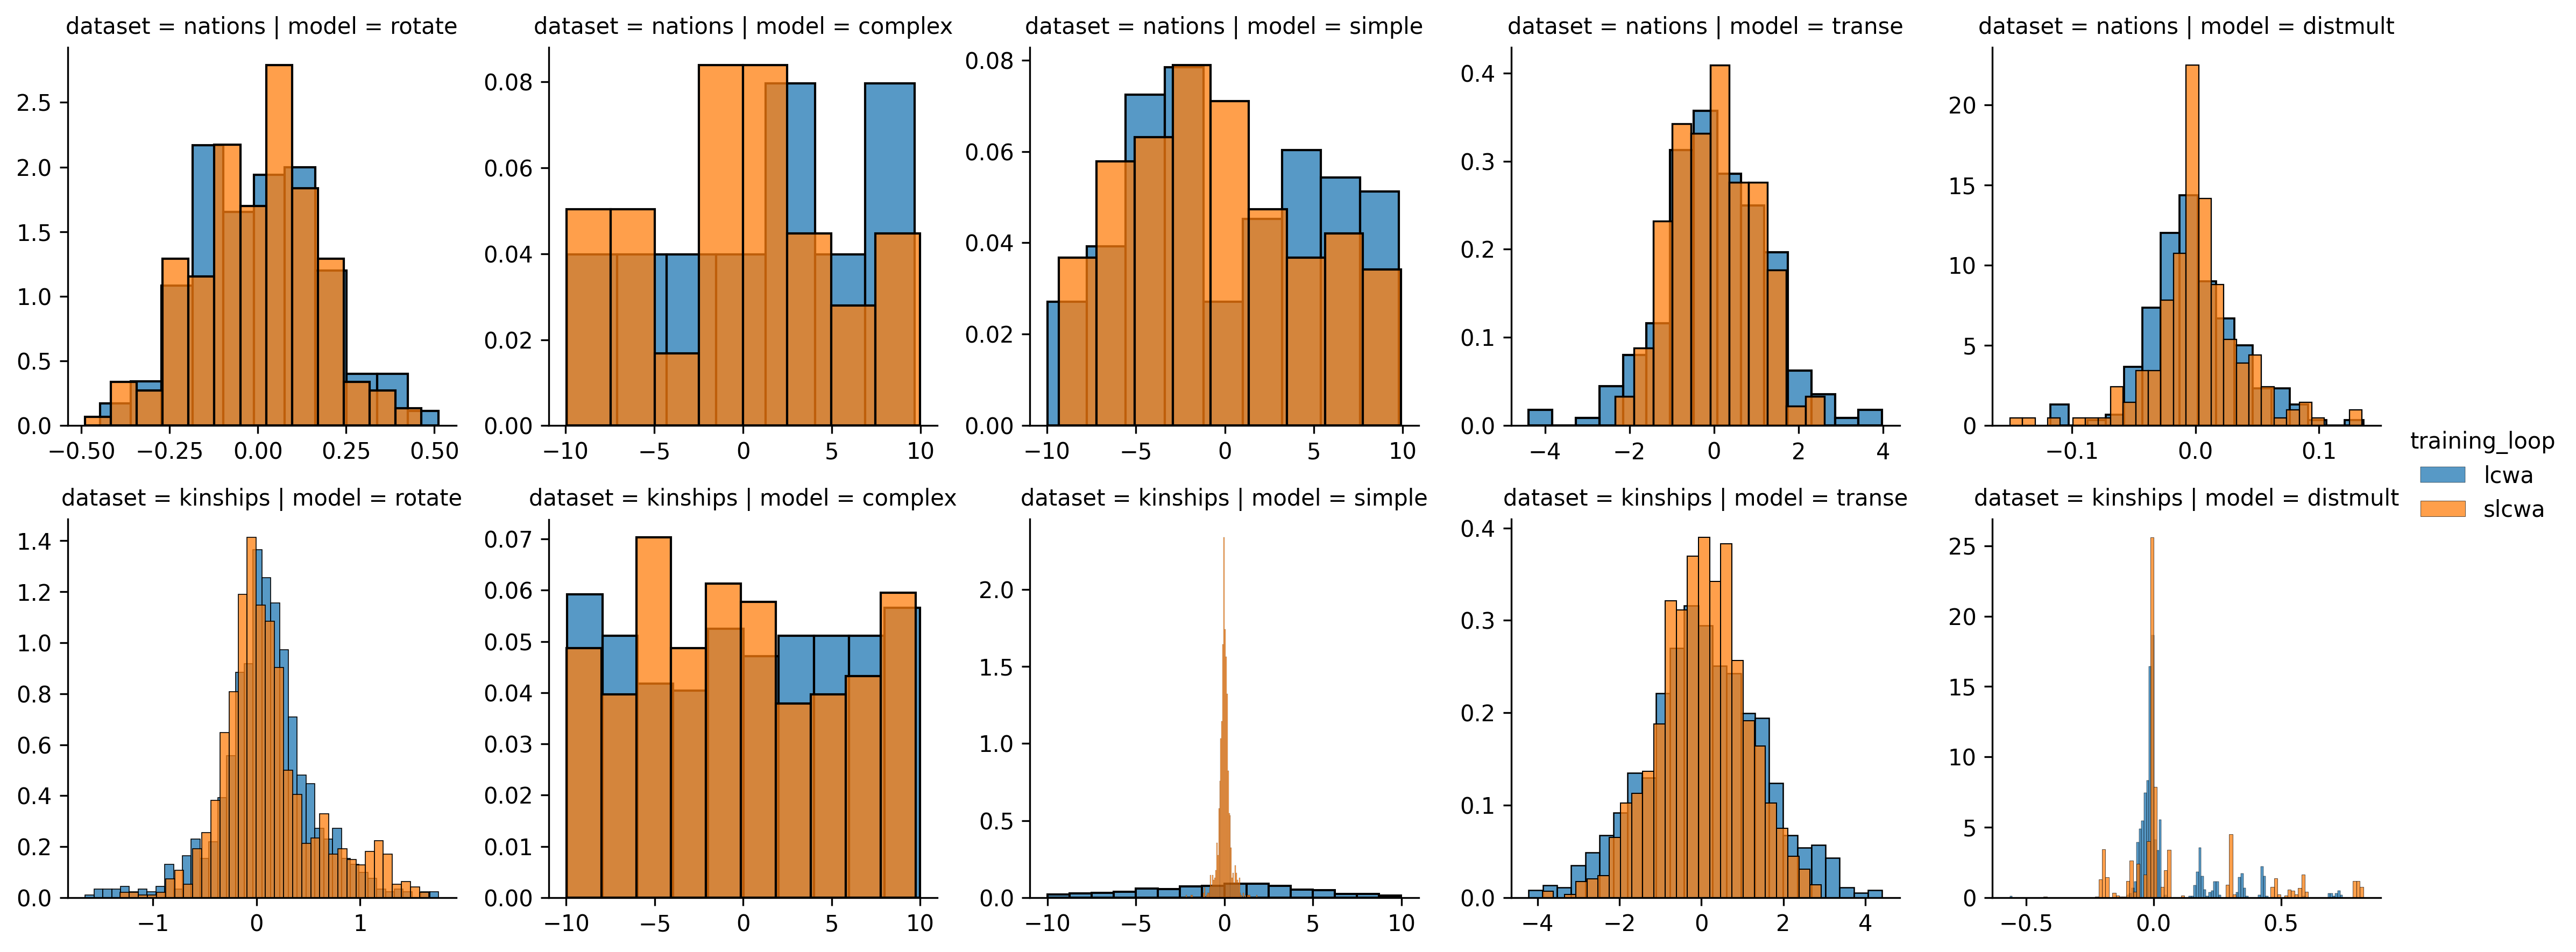
While the script that generated this chart is extensible to all datasets and models, I haven’t got the computational power available today to run them all. All that needs to be done is to add a few more strings to the lists of models, or even better, replace them with the python entrypoint-loaded classes. However, with many experiments, I think the small datasets like Nations and Kinships are sufficient to demonstrate a given phenomena.
There are a few major insights to be taken from this chart. First, the RotatE, TransE, and DistMult model seem to operate pretty similarly for forwards and inverse triples. This is demonstrated by two aspects of the distributions - their normality and tightness (low standard deviation). When considering that each of these are translational distance models, this should come as no surprise.
ComplEx shows neither normality in its distributions nor tightness. This is because ComplEx’s interaction function is explicitly supposed to model the directionality of triples through its use of complex-valued entity embeddings and the use of the non-commutative multiplication operation on complex numbers.
SimplE is an interesting model to consider when studying the difference between forward and inverse triples because it explicitly models the forward and inverse of a given triple then takes the average for its final score. Its strange behavior based on the difference between the stochastic local closed-world assumption (sLCWA) and local closed-word assumption (LCWA) during training could be due to the fact that it is a complete graph (e.g, all pairs of entities have a triple in both directions).
There are definitely more insights and more satisfying explanations to be gained by looking at a larger-scale analysis, but this shows that very quickly, with the artifacts of training and very little time, insight can be gleamed into the possible drawbacks for inference for a given dataset-model-training assumption combination.