Explaining MCI Conversion with Path Queries to NeuroMMSig
In late 2017, I visited the Critical Path Institute in Tucson, Arizona with my colleague Daniel Domingo-Fernández to use our Alzheimer’s disease map encoded in the Biological Expression Language (BEL) and the tools we built with PyBEL to help contextualize their mild cognitive impairment (MCI) conversion models. We got very interesting results, but they had a major overlap with unpublished work of one of our colleagues on the role of KANSL1 in Alzheimer’s disease, so we never reported them. Last week, his paper finally made it publication (congratulations, Sepehr!) so I thought it would be fun to rehash the old results and look at how the results might have changed over time with improvements to the underlying knowledge graph.
After a long flight from Germany and layover in Phoenix (remember before the pandemic when that was a thing?), we were received at the Tucson Airport by Klaus Romero, the Director of Quantitative Medicine at the Critical Path Institute (C-Path). He helped us acclimatized to the quiet, flat plains of the Sonoran Desert with a ride down its long stretches of highways in his BMW V8 on our way to our accommodations in the city.

We were lucky to have arrived at C-Path when we did - Klaus’s team was mostly remote, but met in person once or twice a year. They were the mavericks of the institute - the team of computational biologists, pharmacologists, and toxicologists who took advantage of the deep ties of the institute to regulatory bodies like the American Food and Drug Administration (FDA) to pilot some of the first computational tools to gain regulatory approval for use in a clinical setting.
As our working lay on the computational side of neurodegeneration, we were introduced to Daniela Conrado and her work on a clinical data-driven conversion model from mild cognitive impairment (MCI) to full Alzheimer’s disease. Ultimately, it was a linear mixed-effect model that implicated several clinical exams and measurements as co-variates:
- Clinical Dementia Rating (CDR)
- Clinical Dementia Rating Scale (sum of boxes) (CDR-SOB)
- Mini Mental State Exam (MMSE)
- APOE ε4 status
- beta amyloid 40
- beta amyloid 42
- hippocampal volume
- hippocampal atrophy
It became our goal to use NeuroMMSig (the Alzheimer’s disease map) to identify a potentially explanatory sub-graph (i.e., a mechanism) that connected all the co-variates. We were well-positioned by using a disease map encoded in BEL that allows for the inclusion of multi-scale knowledge across the molecular, pathway, and phenotypic levels in addition to correlative and associative relationships that aren’t so easy (or possible) with other modeling formalisms like BioPAX, SBML, SBGN, Cell Designer, GO-CAM, etc. After spending months re-curating the NeuroMMSig subgraph following the end of the AETIONOMY project, we were excited to apply it and all of its shiny new goodness. What comes below is a slightly edited version of the report we wrote at the end of our visit, hence its more scientific voice (as opposed to my light-hearted blogging voice).
Methodology
When we first mapped the co-variates in the MCI conversion model to nodes in our knowledge graph, we found some had high information density, like the amyloid and APOE nodes, but the clinical measurements were relatively low. While this would generally lead to poor robustness, an advantage of curated knowledge graph-based approaches is that we were able to curate additional relevant knowledge for these nodes by making use of automated and semi-automated relation extraction pipelines as well as manual curation for enrichment. Further, the clinical relationships were curated during the work presented in NIFT project, so we were able to adapt the curation guidelines and apply them once again. We did some curation with the help of master’s student of molecular biology Lukas Beniusis who was working in our group back in Germany as a student research assistant at the time. Ultimately, the resulting curated content found its way to GitHub in the CONIB repository under the CC BY 4.0 license. After substantially broadening the connections with other nodes, more hypotheses could be generated in algorithmic steps.
Graph traversal algorithms were used to find paths connecting the co-variates in the Alzheimer’s disease map that had the appropriate polarity (a series of increases, decreases, positive correlations, and/or negative correlations that matched the observations of the MCI model). These paths were combined to sub-graphs that could be interpreted and so individual paths could be prioritized by their explanatory potential. Finally, the sub-graphs were filtered to best rationalize the MCI model with the relevant molecular biology. All of these steps were done in a local instance of BEL Commons that was loaded with the NeuroMMSig BEL file.

We didn’t spend the entire time in Arizona working. We also got to run in a dried up river bed, play Frogger trying to cross the street, and eat Klaus and his wife’s amazing cooking.
Results
The most interesting hypotheses are presented in the graph below. The first hypothesis (yellow) involves three entities classically associated with AD: the amyloid precursor protein (APP); one of its secretases (BACE1); and the amyloid beta 42 (Aβ-42) proteolytic cleavage fragment from the cleavage of APP by BACE1. They participate in a positive feedback loop where an increase in the abundance of the secretase leads to more amyloid beta aggregation. Since this process is widely described in the literature, there are multiple connections, or crosstalks, from this part of the graph to the more novel paths we describe in the following.
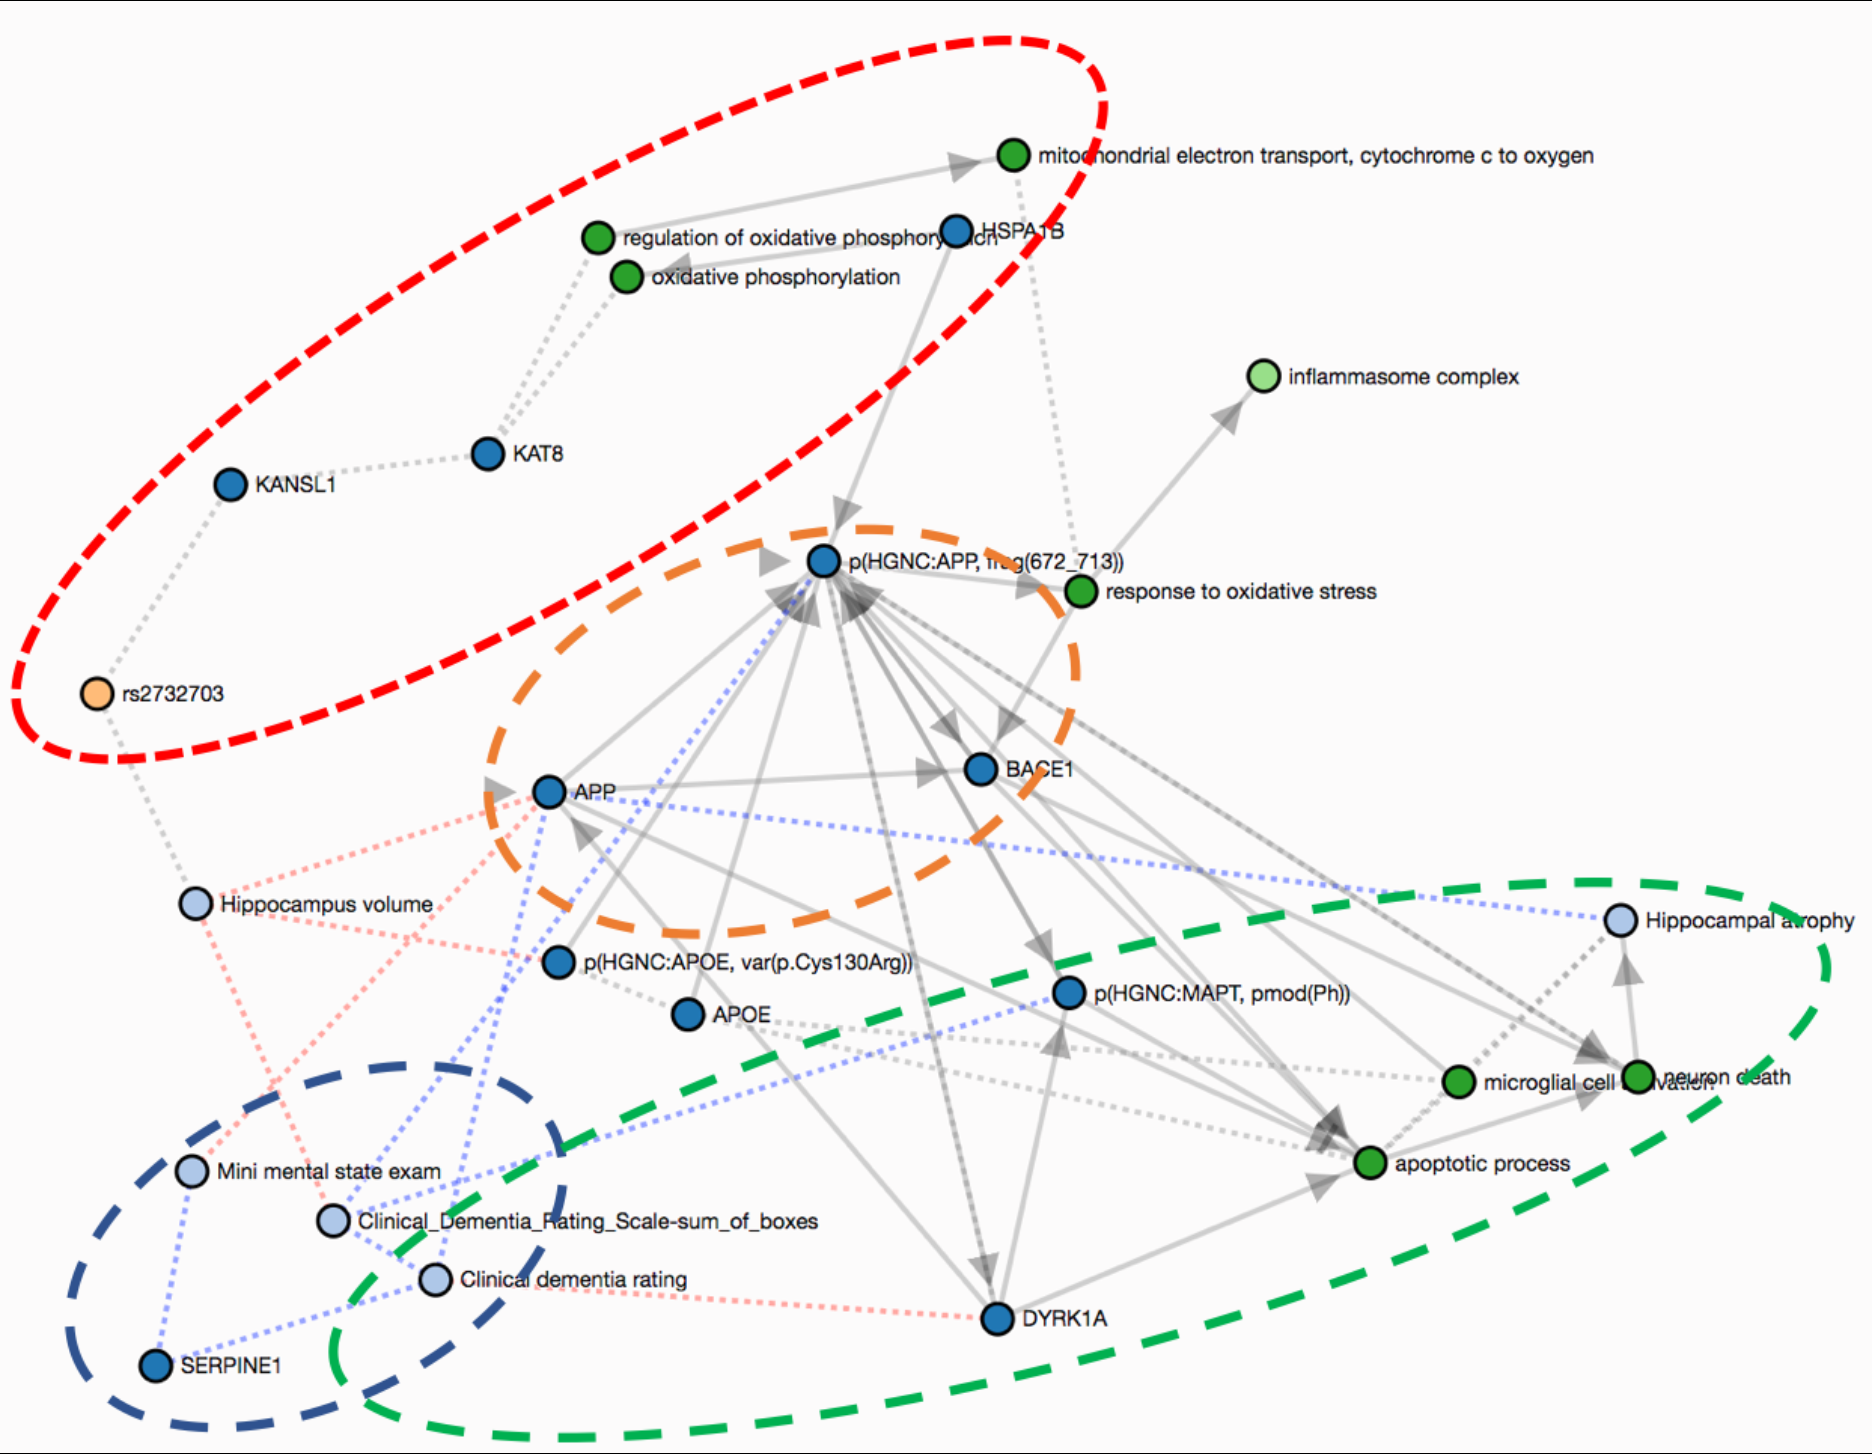
rs2732703
The second hypothesis (red) focuses on the possible effects of the rs2732703 variant in the KANSL1 gene, which has been statistically linked to the hippocampus, and indirectly to hippocampal volume. The gene product of KANSL1 forms an acetylation complex with KAT8 that regulates the expression of genes involved in the oxidative phosphorylation localized in the mitochondria. Therefore, dysregulation of the transcription of the KANSL1 gene due to this variant might lead to oxidative stress and ultimately to inflammation — one of the main processes associated with AD.
There may be a crosstalk between APP and KAT8 since the APP intracellular domain (AICD) has been observed to form a ternary complex with FE65 and KAT5. Because KAT5 and KAT8 both share the domain that mediates the formation of this complex (histone acetyltransferase domain, MYST-type ( IPR002717)), we suggest that KAT8 could act through the same mechanism as KAT5 to regulate the expression of multiple genes (Müller et al., 2013).
DYRK1A
The third hypothesis (green) suggested by the subgraph involves DYRK1A (dual specificity tyrosine-phosphorylation-regulated kinase 1A) which is negatively correlated with the Clinical Dementia Rating Scale - Sum of Boxes (CDR-SoB), a cognitive score included in the clinical MCI model. This kinase phosphorylates two proteins deposited in the brain that are hallmarks of AD: tau protein (MAPT) and APP (Wegiel et al., 2011). While hyperphosphorylation of the Tau protein causes the aggregation of neurofibrillary tangles, phosphorylation of APP increases its cleavage leading to higher levels of beta-amyloid. Furthermore, DYRK1A acts as a regulator of apoptotic processes and neuronal death, which might result in hippocampus atrophy (Choi & Chung, 2011).
SERPINE1
The final hypothesis (blue) is predicated by the positive correlations between SERPINE1 abundance and two co-variates from the MCI model: the CDR-SoB and the mini mental state exam (MMSE) (Oh et al., 2014). These correlations motivate further curation that could provide more causal insight as well as investigation of measurements of this protein as a biomarker for these clinical endpoints.
Afterthoughts
Our findings highlighted crosstalk between several well-known mechanisms (e.g., beta-amyloid, oxidative stress, and inflammation) and the co-variates observed by the MCI model. Furthermore, the analysis identified various controllers that might regulate these processes: rs2732703, DYRK1A, and SERPINE1 that may be appropriate to investigate in a clinical setting.
However, knowledge-based approaches are inherently incomplete, and are not a replacement for hypothesis-driven experiments or clinical trials. Even in our analysis, we were not able to account for some co-variants, such as sex, because of the nature of the data structure for storing knowledge and the granularity of available knowledge itself. Interpreting hypotheses generated by a purely knowledge-driven environment also requires great care. In this exercise, we postponed exploration of another classic co-variate, the APOE mutations due to this constraint.
Additional knowledge enrichment around the clinical endpoints used in MCI models could be used to provide further support for these hypotheses as well as facilitate the generation of new hypotheses. Back in 2017, we wrote that future work could include expansion of the graph around the genes of interest with dedicated literature mining approaches as well as enriching the graph with further knowledge around the co-variates. I mentioned Sepehr’s paper A Systems Biology Approach for Hypothesizing the Effect of Genetic Variants on Neuroimaging Features in Alzheimer’s Disease at the onset in which he prioritized curation around the SNPs associated with Alzheimer’s disease and related neurodegenerative diseases like Parkinson’s disease through genome-wide association studies (GWASs). He also converged on the KANSL1 gene through an orthogonal analysis after which he (luckily) did orthogonal curation to ours to add additional content to NeuroMMSig than what we did. In the years since this analysis, we also made huge improvements to PyBEL and BEL Commons, the interactive visualization platform in which we did the analysis presented here that makes it much more simple and flexible.
Despite several publications using the NeuroMMSig BEL content, none were ever accompanied by a release of the underlying BEL content. In 2018, I began to lead work on the Human Brain Pharmacome Project which included additional curation to enrich NeuroMMSig. I made sure that all of this found its way directly into the open source. If/when the NeuroMMSig BEL content is made publicly available, I will follow up this post with a very short script showing how to do the following to reproduce the graph presented above:
- Load a BEL graph
- Create a shortest paths query using the
pybel.struct.get_subgraph_by_all_shortest_paths()function - Visualize the resulting subgraph in a Jupyter notebook.
Until then, good luck with the next wave of (endless) beta amyloid antibodies!
References
- Choi, H. K., & Chung, K. C. (2011). Dyrk1A positively stimulates ASK1-JNK signaling pathway during apoptotic cell death. Experimental neurobiology, 20(1), 35-44.
- Domingo-Fernández, D., et al. (2017). Multimodal Mechanistic Signatures for Neurodegenerative Diseases (NeuroMMSig): a web server for mechanism enrichment. Bioinformatics, 33(22), 3679-3681.
- Müller, T., et al. (2013). A ternary complex consisting of AICD, FE65, and TIP60 down-regulates Stathmin1. Biochimica et Biophysica Acta (BBA)-Proteins and Proteomics, 1834(1), 387-394.
- Oh, J., Lee, H. J., Song, J. H., Park, S. I., & Kim, H. (2014). Plasminogen activator inhibitor-1 as an early potential diagnostic marker for Alzheimer’s disease. Experimental gerontology, 60, 87-91.
- Wegiel, J., Gong, C. X., & Hwang, Y. W. (2011). The role of DYRK1A in neurodegenerative diseases. The FEBS journal, 278(2), 236-245.
Subgraph Reference PMIDs
- rs2732703: 25778476, 27768893, 21034527, 22544363, 27768893, 23092889
- DYRK1A: 21156028, 22110360, 25116835
- SERPINE1: 25304332