Current Perspectives on KGEMs in and out of Biomedicine
After many discussions scientists from AstraZeneca’s knowledge graph and target prioritization platform (BIKG) about the PyKEEN knowledge graph embedding model package, I joined them in writing a review on biomedical knowledge graphs. I’m giving a talk in their group tomorrow - this blog post is a longer form of some ideas I’ll be presenting there. Here are the slides.
Who is the Arbiter of Benchmarks?
The publication of each new knowledge graph embedding model is usually accompanied by an evaluation of the link prediction task on common benchmark datasets and a comparison to previous models’ performances on those datasets. There’s a variety of ways authors report this, either by copying the original results from the original papers describing the competitor models, by re-running the author’s original code, by reimplementing the code themselves, or by running an implementation from a larger knowledge graph embedding model package.
Who can be trusted? The original authors of each competitor model were/are motivated to show that theirs was better than others, so their paper might have inflated metrics. The authors of the current paper are motivated to show that previous models are worse, so they may deflate metrics for old models (and inflate theirs). Knowledge graph embedding model packages are motivated to inflate metrics to show that using their package is better – I’ve indeed been asked questions about why other packages are “performing better” than PyKEEN and had to answer that they’re just evaluating differently that is less conservative, and sometimes misleading. Even in a world without these competing interests, it’s very hard to understand each other’s code, especially since it’s not just about the model itself but also the training and evaluation pipeline.
This motivates large benchmarking studies that use unified frameworks and re-implementations of models to investigate the relative performances of models (and can for a brief moment, let you throw away your metric fixation). The PyKEEN benchmark is the largest and most comprehensive to date, covering many models, datasets, and configurations. I was proudly a part of this work under the leadership of Mehdi Ali @mali-git and with an amazing team. There’s also the smaller LibKGE benchmark as well as several others that we’re maintaining in a curated list in this meta-review repository.
The Open Graph Benchmark (OGB) provides a potential solution to these issues by externalizing and standardizing the code that evaluates the results. There are still sneaky ways to game this that I won’t describe in detail, but I like the concept. However, the framework does not cover some of the more popular datasets and the ones that it does introduce in the link prediction task, it does not do so with any provenance on how they’re created. During my talk, Benedek Rozemberczki (@benedekrozemberczki) brought up another interesting point - many of the benchmarks in OGB have surpassed the size that can be addressed by the physical infrastructure or cloud compute budgets of many small academic institutions. As machine learning continues to rely on larger, more exotic models, we will soon have to reckon with this divide.
Testing/Validation Leakage
Leakage is when triples in the testing/validation sets can be trivially inferred from triples in the training set. This leads to an over-estimation in the performance of the model.
The most common form of leakage occurs when a knowledge graph contains inverse triples. An example:
AandBare entities in a knowledge graphpart ofandhas partare inverse relations in the knowledge graphA part of Bis in the training setB has part Ais in the testing set
This scenario occurs in two datasets widely used in knowledge graph embedding model benchmarking: the FreeBase 15K (FB15k) dataset proposed by Bordes et al. (2013) alongside the TransE model and the WordNet-18 ( WN18) dataset proposed by Bordes et al. (2014) alongside the Unstructured Model. Toutanova and Chen (2015) outlined an algorithm for removing leakage due to inverse triples and applied it to respectively derive two new datasets: the Freebase 15K-237 (FB15k-237) dataset and the WordNet-18 (RR; WN-18RR) dataset.
| Dataset | Entities | Relations | Triples |
|---|---|---|---|
| WN-18 | 40,943 | 18 | 151,442 |
| WN-18RR | 40,559 | 11 | 92,583 |
| FB15k | 14,951 | 1,345 | 592,213 |
| FB15k-237 | 14,505 | 237 | 310,079 |
These datasets are of roughly the same size and are widely available. Therefore, if I read a paper that presents results on only FB15k and WN-18 but not FB15k-237 and WN-18RR, I am concerned that the authors either do not know about this problem, or are intentionally misleading the reader.
An alternative kind of testing leakage can occur in chemoinformatic applications. The following three chemical structures are from a structural class called statins (CHEBI:87631) that inhibit the HMG-CoA reductase enzyme and are often used to lower blood pressure to reduce the risk of heart disease.
| mevastatin (CHEBI:34848) | lovastatin (CHEBI:40303) | simvastatin (CHEBI:9150) |
|---|---|---|
All three share a stereospecific cyclic lactone motif (top right part of the molecule) that result in their functional activity. If you’re building a classifier for activity against HMG-CoA reductase, or more generally, a link prediction model that includes chemical-protein or chemical-enzyme class predictions, including some of these molecules in the training set and others in the test set would enable trivial inference and ultimately result in an over-estimation of the performance of your model (barring discussion about how this could be considered trivial is a huge triumph of modern pharmacology and cheminformatics). The solution often referenced in proteochemometrics papers is to use scaffold-based splitting like Bemis-Murcko scaffold splitting or to pre-cluster molecules based on structural similarity and to split based on clusters. More information on these methods is reviewed in Bongers et al. (2019) and Parks et al. (2020).
Redundant Information in Graphs
Transcriptomics experiments are often analyzed with statistical over-representation analysis or gene set enrichment analysis (GSEA) with respect to gene sets derived from pathway databases like KEGG, Reactome, WikiPathways, the Pathway Interaction Database, and BioCyc, functional annotations such as those from the Gene Ontology, and biological signatures such as those listed in MSigDB. In addition to p-values, the high number of statistical tests also motivates the reporting of adjusted p-values to address multiple hypothesis testing. However, these adjustments do not consider the high overlap in information due to the redundancy of pathway databases or potential correlations between expert-defined pathways and certain functional or biological signatures. Therefore, several results from the same theme or biological phenomena often co-occur as enriched which often leads to an inflated sense of concordance of results and thus higher confirmation bias. Further, Mubeen et al. (2019) showed that the variability of definitions in each pathway database for the “same” pathway (e.g., apoptosis) caused significantly different results in many downstream tasks.
Many benchmark biological knowledge graphs such as Hetionet and OpenBioLink include multiple pathway databases. Therefore, link prediction tasks between genes and pathways (such as the case scenario presented in Ali et al., 2019) could be skewed both during the training and evaluation of link prediction models, and ultimately in the interpretation of predicted results. While methodological improvements like SetRank (Simillion et al., 2017) have been proposed to mitigate the redundancies in the over-representation analysis setting, there have not yet been methodological improvements for link prediction models that consider these kinds redundancies. Further, these kinds of redundancies do not fit as neatly into the “leakage” issue.
Tools like ComPath can be used to enrich KGs with links between functionally equivalent pathways, but this kind of information is not readily used by typical knowledge graph embedding models. Alternative rule-based and symbolic reasoning systems might present solutions in this area.
The Effect of Non-Determinism
There are several meaningful non-deterministic factors that affect the performance of a model:
- The effect of random initialization. The commonly used
pytorch.nn.Embeddinginitializes its weightings by default with the vanillapytorch.nn.init.normal_function. Using alternative parameters for the distribution (e.g., Xavier/Glorot) have been shown to improve performance in a variety of settings. - The effect of non-determinism during training that occurs during batch shuffling. This has shown to quicken convergence and mitigate overfitting based on the ordering of training data.
- The effect of random negative sampling when training under the stochastic local closed world (sLCWA) assumption.
To compensate for the non-determinism, several trials using the same settings should be run and the distribution of each metric (or at minimum, summary statistics over their means and standard deviations) should be presented. Below, the distribution of mean ranks resulting from 10 trials of training of several models on the Hetionet dataset are presented (credit to Stephen Bonner @sbonner for running this trial and generating the chart).
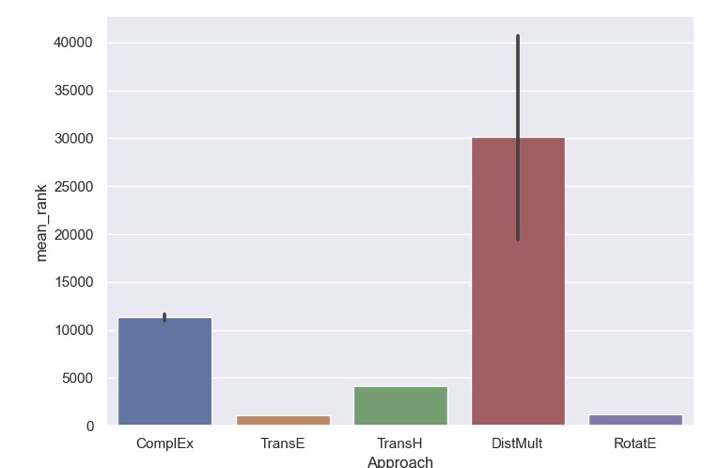
From this chart, it is obvious that the DistMult model has the potential to perform both very well and very poorly based on the random initialization. There are two reasons that this might be the case for this model/dataset in particular:
- The interaction for DistMult function uses the Hadamard operators, which
commute, so
f(h,r,t) = f(t,r,h). With the Hetionet dataset, where there is meaningful directionality and also the existence of inverse edges, this could be a liability to both meaningful training and accurate evaluation - The L_1 norm formulation of DistMult makes it much more susceptible to random
initialization than if the L_2 norm were specified. Because the original
formulation of the DistMult model uses the idiom of matrix factorization, the
norm’s
pis not configurable within PyKEEN (the tool used to train these models and generate these charts).
While there are a few insights into the formulations of models and the properties of datasets that could inform users to avoid using models like DistMult with datasets like Hetionet, the more general case is likely more bleak - even small changes in hyper-parameters could potentially affect the robustness of a model to non-determinism. However, there does not yet exist a comprehensive benchmarking study (even over small KGs) to confirm this nor elucidate general insight.
As an end note - this is not meant to say that non-determinism should be mitigated nor removed. It is a vital part to creating meaningful results and fixing the random seed is certainly not a viable solution.
Splits Aren’t Gospel
Benchmark datasets for knowledge graph embedding models typically consist of a pre-stratified training, testing, and validation set. The FB15k, FB15k-237, WN18, WN18-RR, and YAGO3-10 are the most commonly used to assess the performance of new models or compare the performance of old models due to their relatively small sizes. More specifically, the same exact pre-stratification is used in all papers.
While this potentially could make results more comparable across different experiments, it presents a huge liability in that it is another “random” effect that is completely discarded. Rather than present results on a single split, results should be presented as a distribution over several splits to show if there are certain properties of the split that cause some models to perform better than others. Perhaps this kind of evaluation would have informed Bordes et al. about the issues with the FB15k and WN18 datasets before they were later identified by other authors. This also presents a practical problem since there are potentially many ways to generate dataset splits, and typical knowledge graph embedding model researchers likely aren’t interested in adding another level of cross-validation to their already complex pipelines.
This issue is more apparent when applying knowledge graph embedding models to datasets that are not pre-stratified such as the Common Sense Knowledge Graph, NELL, or any biomedical knowledge graph. It can again be demonstrated with another image from Stephen Bonner. Below, the distribution of mean ranks resulting from 10 random splits of the Hetionet dataset and using the same training configuration for several models.
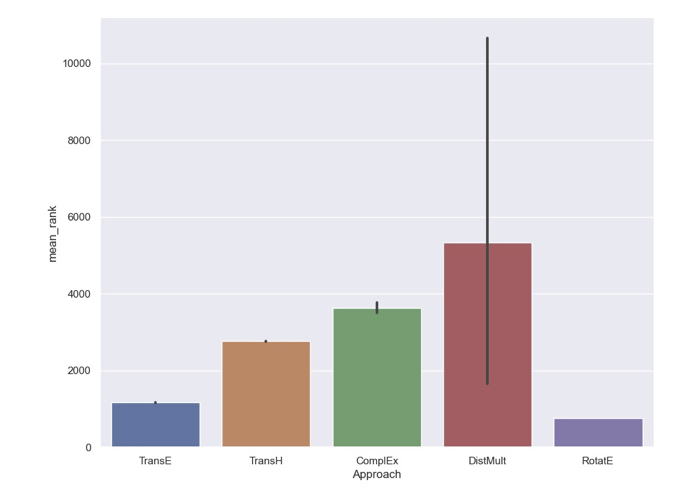
The confidence intervals support an even more startling conclusion - the effect of random splitting of the dataset could cause a model like DistMult to outperform models like ComplEx due to its huge variance. Further, datasets like Hetionet definitely are susceptible to the leakage problem. Note: there’s a prototype implementation of the Toutanova and Chen algorithm for removing leakages in PyKEEN, but it’s neither finished nor integrated in the PyKEEN pipeline. Combine with DistMult’s penchant for modeling inverse relations the same as the canonical ones, this could wreak havoc on its performance depending on how bad the leakage was by chance. Like with random initialization, there has not yet been a comprehensive benchmarking that could give more general insight into the liabilities of not reporting distributions of results over several random splits. Even further, combine with the previous section’s prescription to report distribution over multiple random initializations, doing a “proper” investigating of robustness seems to be getting more high dimensional.
Do KGEMs Actually Learn?
The formulation of the link prediction task on knowledge graphs as a binary classification task over a dataset of true positives and randomly sampled negatives (under the local closed world assumption) is already a concession to many more obvious machine learning tasks (like classifying Mendel’s irises). Even further, many machine learning techniques have the concept of a null model against which they can compare if their results are meaningful, or just good by chance. In classification tasks, this is often done with y-scrambling which compares the evaluation metric obtained from the real dataset to the evaluation metrics obtained by repetitively shuffling the response variable and generating a null distribution of evaluation metrics against which the real one can be compared. Ultimately, the p-value of a one-tailed test against this distribution tells you if you actually learned something, or if your results are the same as what you’d get with a random dataset.
While this is a pretty typical test that reviewers ask for in other machine learning tasks, it has not (yet) penetrated the knowledge graph embedding model domain. I think this likely limited by the difficulty in writing performant research code. While tools like PyTorch BigGraph and Amazon’s DGL are able to scale across many machines or GPUs, they are not accessible to anyone without significant dev-ops abilities nor are they frameworks that could support researchers. PyKEEN itself has the opposite problem (for now, get hyped for new improvements in 2021). A solution might lie in Marius, a new knowledge graph embedding model library that could be the best of both worlds. Assuming these weren’t considerations, there are two themes through which I could see the question “did I learn anything?”: knowledge graph reorganization and knowledge graph deterioration.
The idea of reorganization is a bit more classic, coming from previous approaches. There are a few concepts that could be used to generate derived knowledge graphs based on a given one that could be use to generate null networks:
- Degree-preserving network shuffle (pmc:PMC3307026; pmc:PMC5168876)
- Xswap (paper; code)
- Relabeling of nodes, similarly to the y-scrambling technique
Himmelstein et al (2017) provides a gold standard on how these techniques could be used to report on how meaningful results are from a link prediction model on a knowledge graph.
The idea of deterioration encompasses randomly removing edges from the knowledge graph and training. It could determine how much of knowledge graph is actually needed to train the model to make meaningful prediction. This would be done for multiple increments (e.g., remove 10% of the training set, remove 20% of the training set) with multiple trials on each.
Are KGEMs King Now?
The COVID-19 pandemic has not only been a battle for public health, but it has also resulted in the largest wave of low quality scientific work in recent memory. Lots of this low-quality work included half-baked usage of network representation learning, matrix completion, and for the first time, knowledge graph embedding models in the mainstream to predict drug-disease links. It was lacking on many fronts: the formulations of knowledge graphs, the evaluation of training and link prediction, and the communication of results.
As a critique, I will share with you my own drug repositioning algorithm for COVID-19: take the list of all drugs in DrugBank, and randomly select 100 of them. You’d be surprised how competitive this algorithm is with others.
The more upsetting examples was from a very prominent network science group that used the RotatE (and other standard) knowledge graph embedding models for the link prediction task for drug repositioning for COVID-19. They evaluated the task on its ability to recover drugs that had already gone into clinical trials for COVID-19, and claimed victory because they were able to recapitulate enough of the list. This was a bad evaluation because the drugs in the clinic were there based on inference made on the same data used to train and evaluate the model. More importantly, it was bad because it was a famous group that misrepresented the way science is done - link prediction in biomedicine is a way to generate hypotheses that can be tested in the lab. Focusing communication around its ability to recapitulate what’s in the training set (i.e., overfitting) is one of the first lessons that students are taught to avoid in their introduction to machine learning classes.
Does this mean that knowledge graph embedding models are king now? No - there’s still a long way to go in biomedicine before they are accepted as canonical tools, that must include some more high-profile papers in that include experimental evaluation of the results. This will most likely happen in the chemistry or target prioritization domains, where the predictions of the model can motivate experiments of actual value.
As a few of the vignettes in this post mentioned, there are still problems with model formulation that can cause huge performance deficits on biomedical knowledge graphs. A different class of models based on random walks, while less complex than knowledge graph embedding models, continue to perform well on tasks in biomedical knowledge graphs because their formulation is oriented towards extracting local community structure - a feature that is very important in biology. Several attempts have been made to extend these to better take into account directionality and edge type. Some of those generalizations even fit into the philosophy and architecture of graph neural networks (GNNs). Further, there are lots of quantitative data such as chemical-enzyme IC50 values, chemical-receptor EC50 values, GWAS p-values, etc. that all have widely different scales and dynamic ranges that are difficult to simultaneously incorporate in any of these methods in a meaningful way.
Willkommen in der Zukunft (The Future)
Random parting thoughts:
Biomedical knowledge graph benchmarks are consistently topping out around 5 million edges. If I had to guess, that’s because that’s the number where if you go higher, you have to start using some packages that are not meant for users like Amazon’s DGL or PyTorch’s BigGraph. We’ll need more accessible, scalable systems if we’re ever going to move on from drug repositioning, where there are only on the scale of thousands of chemicals against hundreds of proven targets, to bona fide drug discovery, where there are on the scale of billions of chemicals (or more if you want to get fancy with virtual screening) against potentially the whole genome of ~20K protein coding genes, the products of other non-protein-coding genes, and other stuff floating around in and around the cell.
Negative knowledge should be emphasized. Formats like the Biological Expression Language (BEL) should support its curation, natural language processing systems and tools like INDRA should start extracting in bulk, and the concept of the open world assumption, local closed world assumption, and closed world assumption need to be amended to better reflect the reality that we know some negative knowledge, but it’s distributed across different relations in different densities.
Genes, RNAs, and proteins are not the same! Even worse, they can have several variants due to differential splicing, and they can have all sorts of pre- and post-translational modifications. BEL and related formats like BioPAX can represent these, but the knowledge graph approach to biology tends to throw this away completely. On the other hand, high granular information on this level of specificity is likely too low to make dense knowledge graphs over which typical tasks like link prediction can be successful. This motivates a greater focus on modeling the hierarchies of information (a task at which INDRA excels) to generate knowledge graphs that balance these competing qualities.
The entire semantic infrastructure for building knowledge graphs is improving (I’d like to say in some small part due to the tools I’ve built) that enables mappings between entities, such as Inspector Javert’s Xref database and the new SSSOM format to make mapping data more standardized.